Fig. 3
Download original image
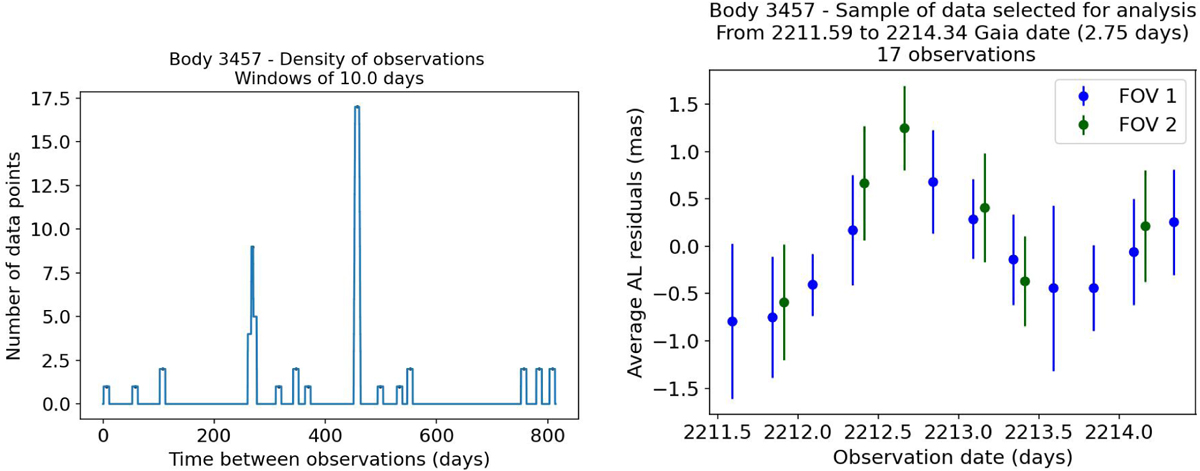
Plots of the density of observations (number in ten consecutive days) for asteroid (3457) Arnenordheim and selected sample of data. Left: resulting convolution of the observation time span in days vs the number of observations in each ten-day window. Right: sample of data at the peak of the 10-day window of search combining 17 observations. The x-axis is the observation date and the y-axis is the average AL residual from the orbital fit. Each dot represents one averaged set of transits observed in the FOV 1 in blue and FOV 2 in green.
Current usage metrics show cumulative count of Article Views (full-text article views including HTML views, PDF and ePub downloads, according to the available data) and Abstracts Views on Vision4Press platform.
Data correspond to usage on the plateform after 2015. The current usage metrics is available 48-96 hours after online publication and is updated daily on week days.
Initial download of the metrics may take a while.