Open Access
Fig. A.1
Download original image
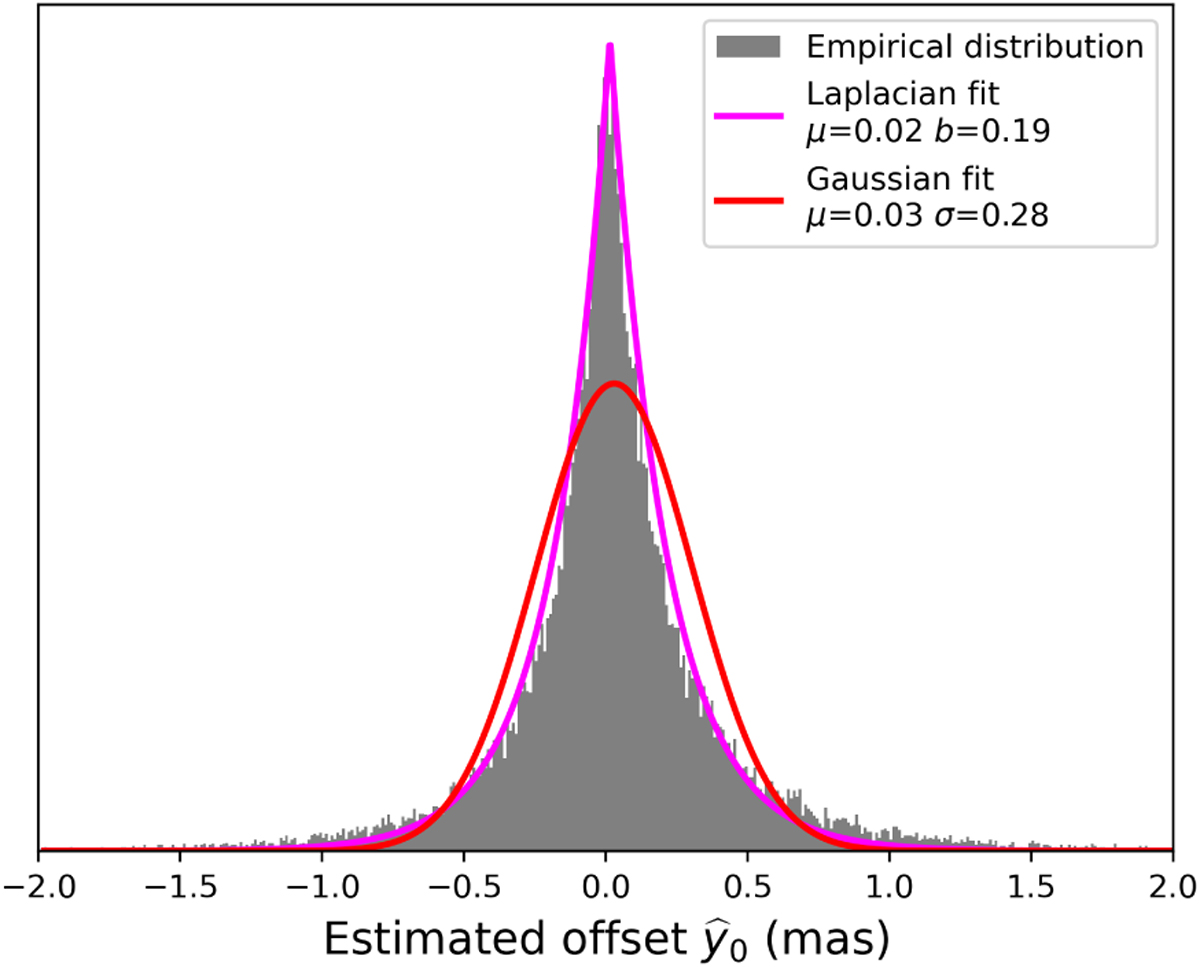
Histogram of distribution of the estimated offset ![]() for each window of search explored. The grey bars represent the empirical distribution, while the coloured lines represent different distributions fitted to the data and their respective best-fit parameters.
for each window of search explored. The grey bars represent the empirical distribution, while the coloured lines represent different distributions fitted to the data and their respective best-fit parameters.
Current usage metrics show cumulative count of Article Views (full-text article views including HTML views, PDF and ePub downloads, according to the available data) and Abstracts Views on Vision4Press platform.
Data correspond to usage on the plateform after 2015. The current usage metrics is available 48-96 hours after online publication and is updated daily on week days.
Initial download of the metrics may take a while.