Fig. 25
Download original image
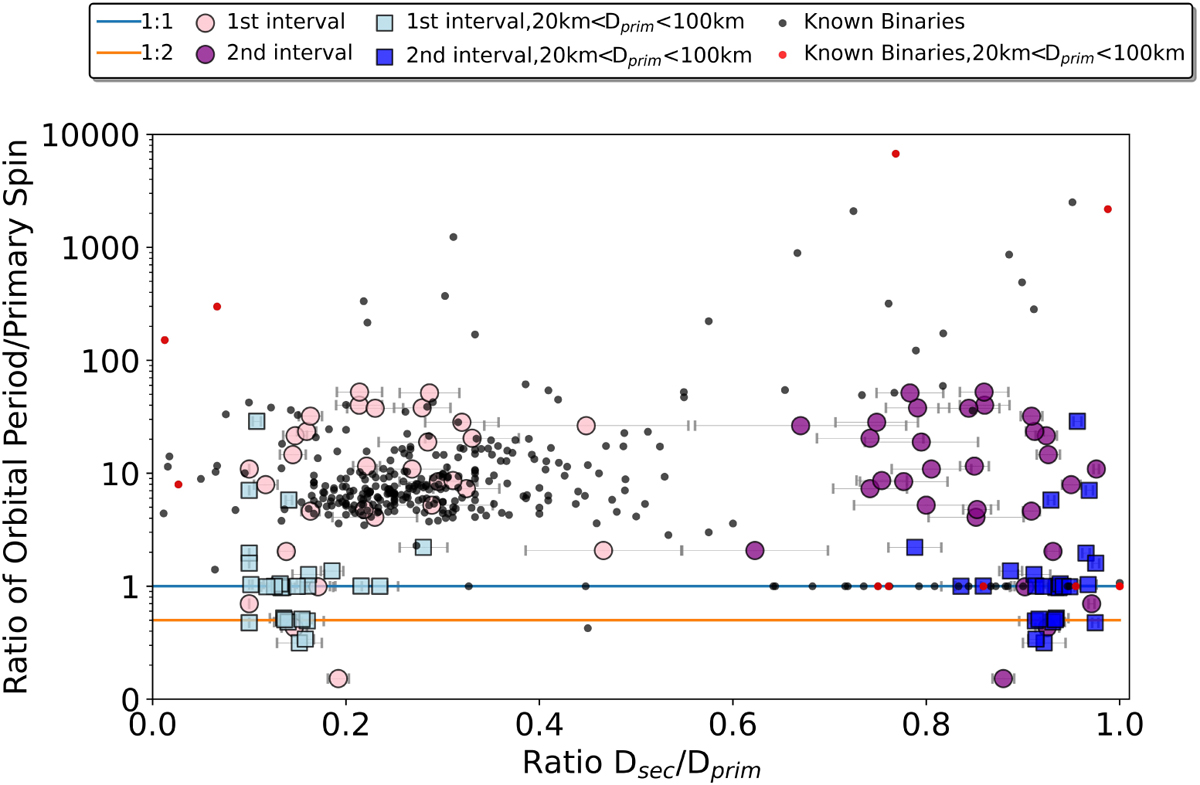
Plot of the ratio of the estimated orbital period (or wobble period) of the secondary over the photometric rotation period of the primary vs. the estimated size ratio of the binary system. The black dots represent all of the known binaries and the red dots highlight those with intermediate sizes (20 km < Dprimary < 100 km). The light and dark purple circles represent the average value of the best-estimated size ratio intervals for objects smaller than 20 km and the light and dark blue circles represent the larger objects. The blue line shows the condition where the estimated orbital period of the secondary is almost equal to the rotation period of the primary object, representing a 1:1 period ratio, while the orange line represents the 1:2 period ratio.
Current usage metrics show cumulative count of Article Views (full-text article views including HTML views, PDF and ePub downloads, according to the available data) and Abstracts Views on Vision4Press platform.
Data correspond to usage on the plateform after 2015. The current usage metrics is available 48-96 hours after online publication and is updated daily on week days.
Initial download of the metrics may take a while.