Fig. 20
Download original image
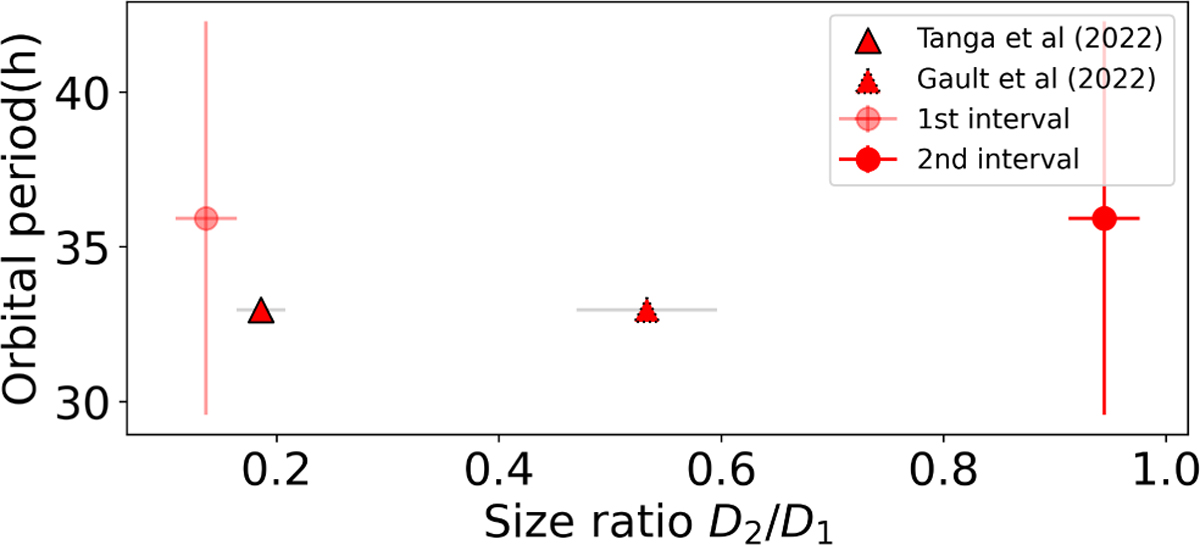
Comparison between the parameters for the Arecibo system. The triangle with black edges and grey error bars represents the values from literature (Table 5), while the circles represent the first (transparent) and second intervals of size ratio estimated from our method using the same wobble amplitude as in Tanga et al. (2023).
Current usage metrics show cumulative count of Article Views (full-text article views including HTML views, PDF and ePub downloads, according to the available data) and Abstracts Views on Vision4Press platform.
Data correspond to usage on the plateform after 2015. The current usage metrics is available 48-96 hours after online publication and is updated daily on week days.
Initial download of the metrics may take a while.