Fig. 14
Download original image
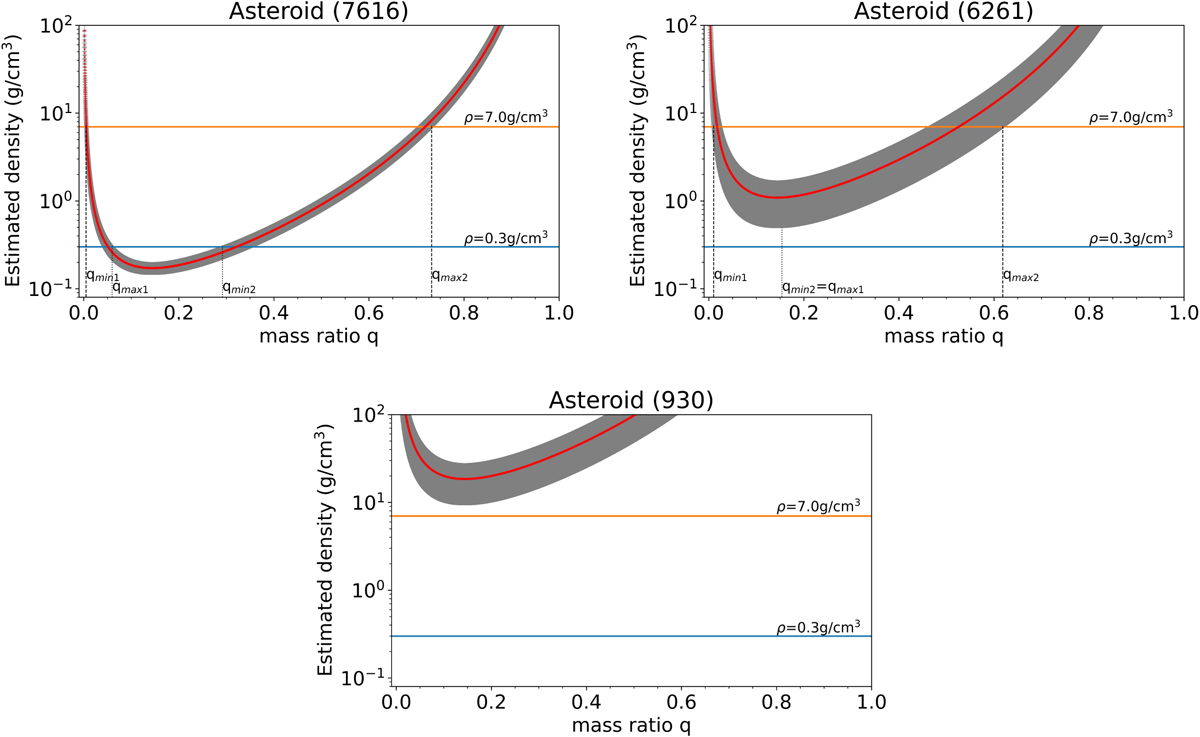
Examples of the bulk density ρ as a function of the mass ratio q for two asteroids, (7616) Sadako (top left) and (6261) Chione (top right). The red line indicates the nominal value. Shown in grey is the error range on the density. The blue and orange horizontal lines represent physically reasonable limits. qmin1, qmax1, qmin2 and qmax2 mark the corresponding extremes of the mass ratio values. The bottom plot shows the case for (930) Westphalia, eliminated in the density filtering because the minimum estimated density is higher than the chosen range of bulk density.
Current usage metrics show cumulative count of Article Views (full-text article views including HTML views, PDF and ePub downloads, according to the available data) and Abstracts Views on Vision4Press platform.
Data correspond to usage on the plateform after 2015. The current usage metrics is available 48-96 hours after online publication and is updated daily on week days.
Initial download of the metrics may take a while.