Fig. 10
Download original image
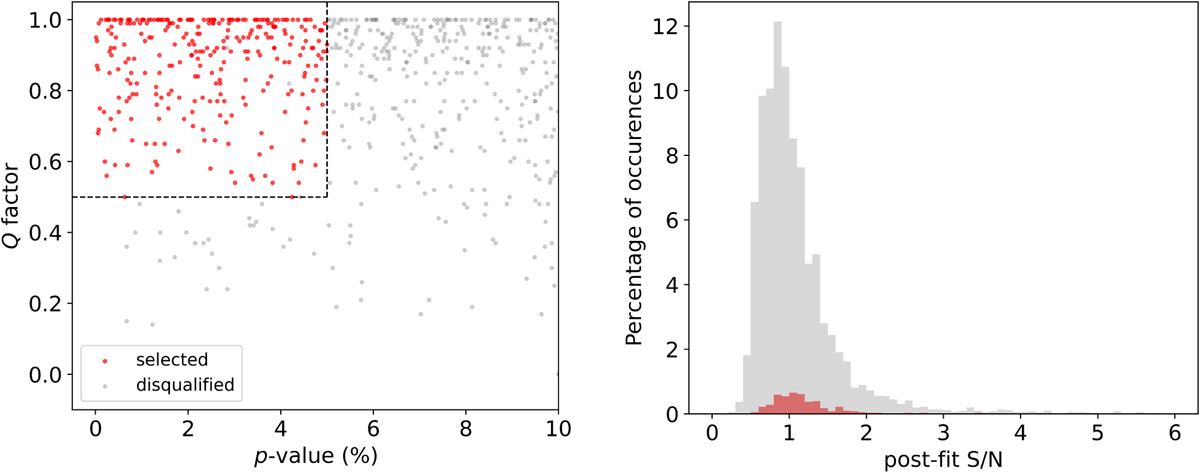
Resulting distribution of parameters from the 6000 simulations in the noise-only scenario. Left: distribution of pairs (p, Q) for the time series simulated. 5391 of the cases have p-value > 0.1 (for these cases the Q factors were not calculated and the corresponding points are thus not shown). The grey dots represent the cases where the data was disqualified as a detection (cases for which p > 0.05, Q < 0.5, or both) and the red dots represent the detections. The two grey points in the top left square are detections discarded due to  > 20 mas. Right: post-fit S/N distribution for the pairs in the left plot.
Current usage metrics show cumulative count of Article Views (full-text article views including HTML views, PDF and ePub downloads, according to the available data) and Abstracts Views on Vision4Press platform.
Data correspond to usage on the plateform after 2015. The current usage metrics is available 48-96 hours after online publication and is updated daily on week days.
Initial download of the metrics may take a while.