Fig. 7
Download original image
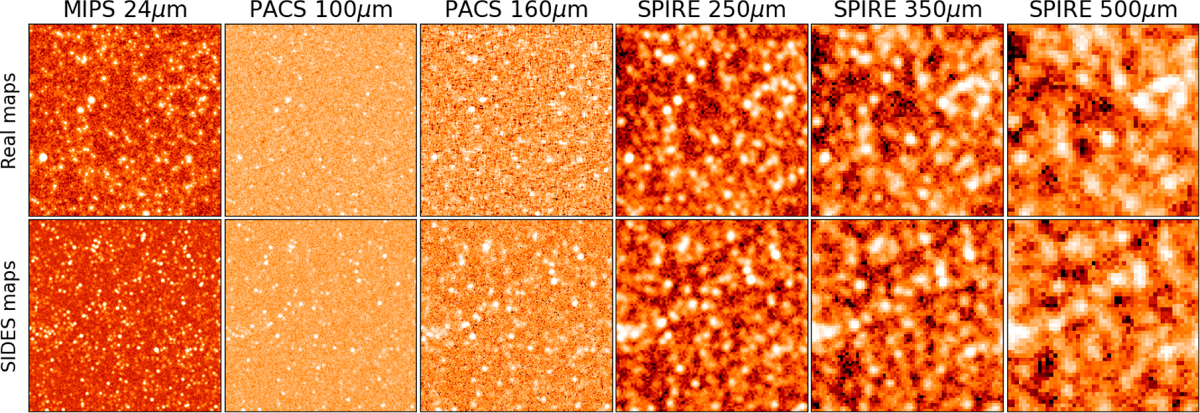
Comparison of the sky (10′ × 10′ cutouts) at different wavelengths. Top row: the same patch of the sky from 24 μm to 500 μm from the real observations (top). Bottom row: similar to the top row but for the SIDES simulation including Gaussian random noise. The simulation can statistically reproduce the observed far-IR and sub-mm sky reasonably well. One can also notice that the PACS 100 and 160 μm maps are much more dominated by instrument noise compared to the maps at other wavelengths.
Current usage metrics show cumulative count of Article Views (full-text article views including HTML views, PDF and ePub downloads, according to the available data) and Abstracts Views on Vision4Press platform.
Data correspond to usage on the plateform after 2015. The current usage metrics is available 48-96 hours after online publication and is updated daily on week days.
Initial download of the metrics may take a while.