Fig. 27
Download original image
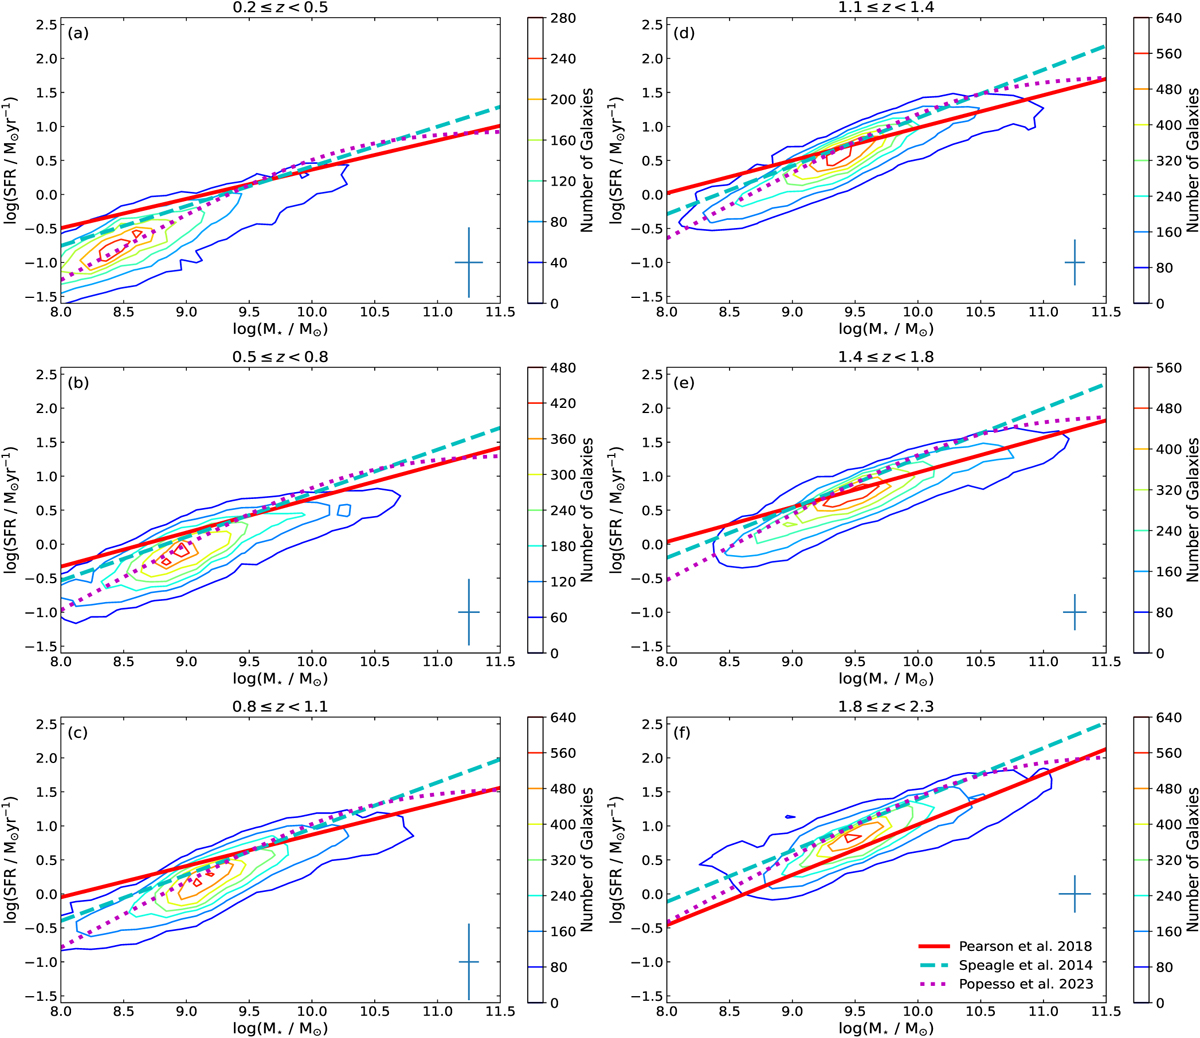
SFR as a function of M* for (a) 0.2 ≤ z < 0.5, (b) 0.5 ≤ z < 0.8, (c) 0.8 ≤ z < 1.1, (d) 1.1 ≤ z < 1.4, (e) 1.4 ≤ z < 1.8, (f) 1.8 ≤ z < 2.3. Red lines are the results from Pearson et al. (2018), dashed cyan lines are the results from Speagle et al. (2014), and dotted magenta lines are the results from Popesso et al. (2023). Blue cross indicates the typical uncertainty in M* and SFR. Colour-coding correspond to number of sources from low (dark blue) to high (red). Data are binned into the same redshift bins as in Pearson et al. (2018).
Current usage metrics show cumulative count of Article Views (full-text article views including HTML views, PDF and ePub downloads, according to the available data) and Abstracts Views on Vision4Press platform.
Data correspond to usage on the plateform after 2015. The current usage metrics is available 48-96 hours after online publication and is updated daily on week days.
Initial download of the metrics may take a while.