Fig. 24
Download original image
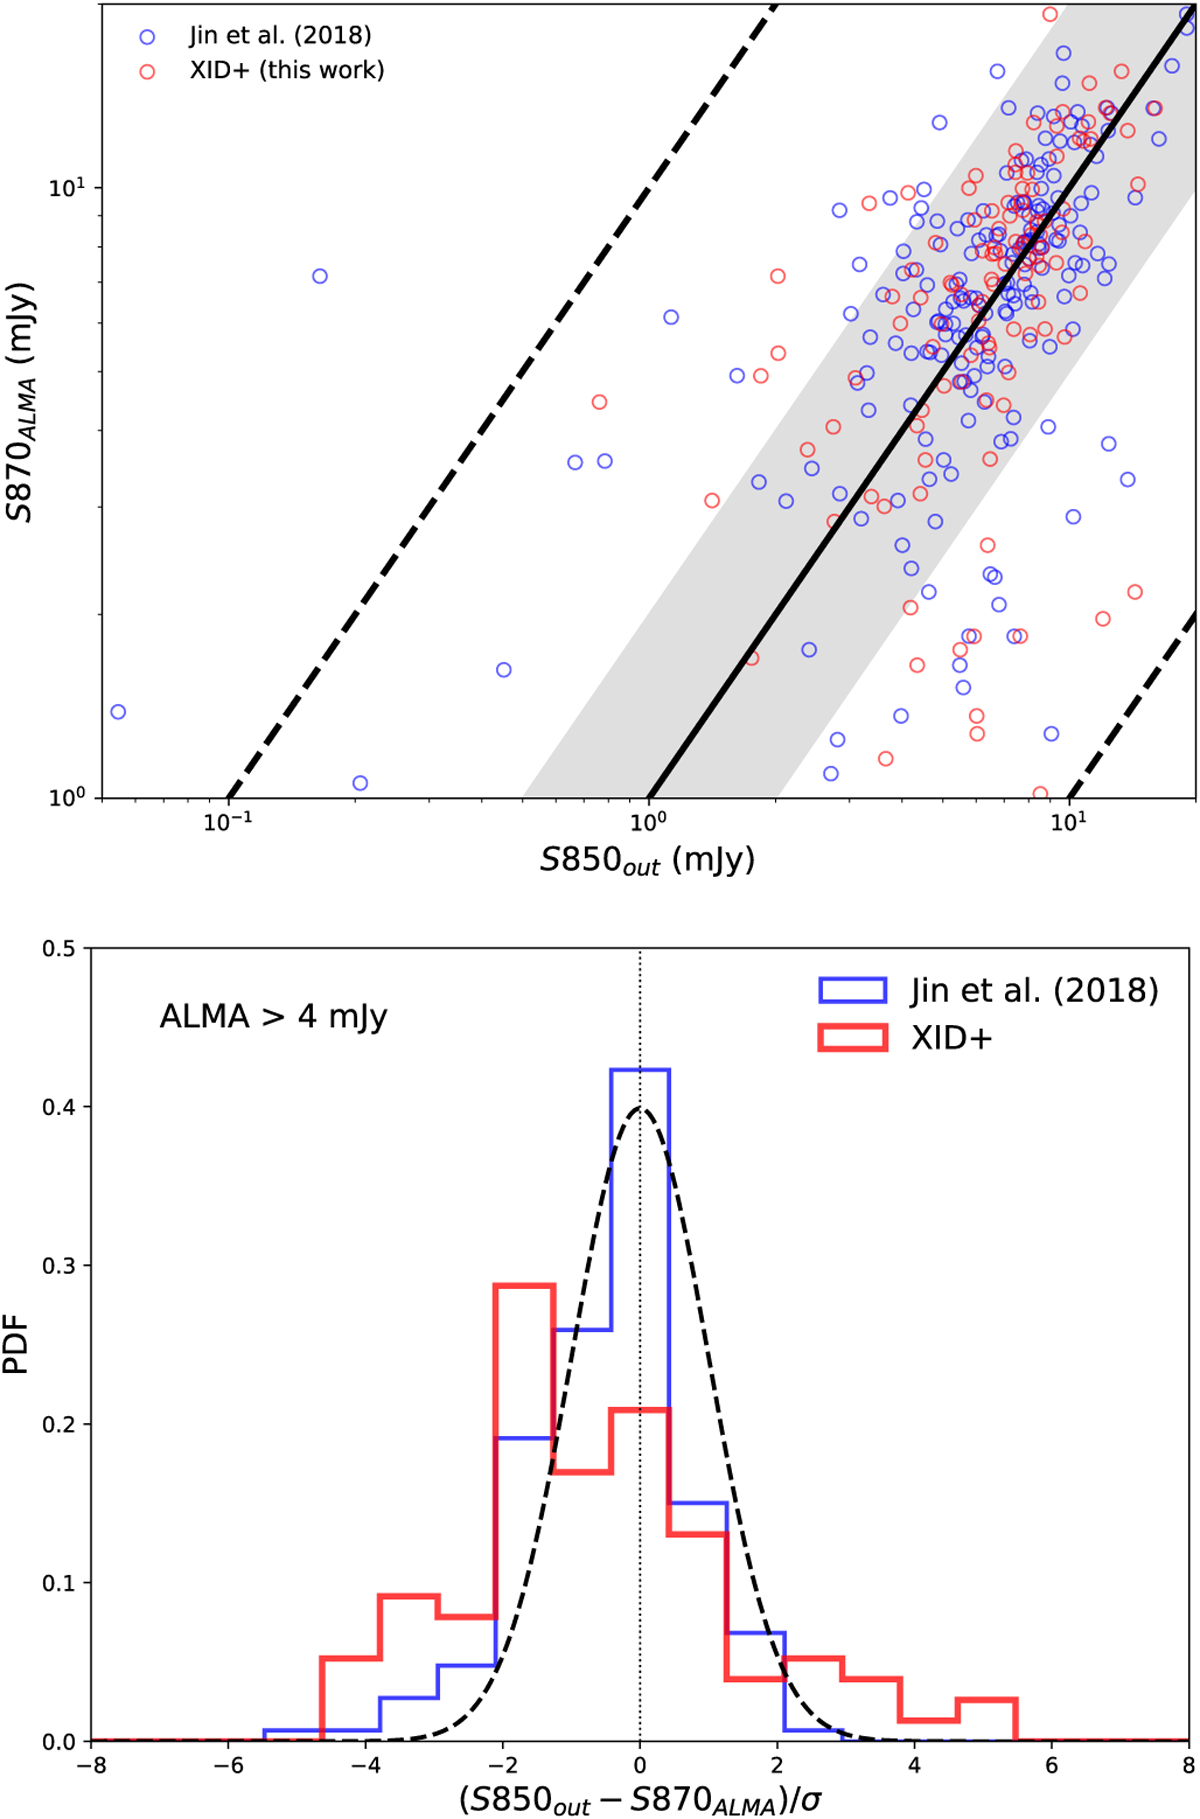
Testing deblended 850 μm flux densities using AS2COSMOS. Top panel: Comparison between deblended 850 μm fluxes (red: XID+; blue: Jin et al. 2018) and ALMA 870 μm measurements. The solid line corresponds to the 1:1 ratio. The shaded region is within a factor of two from the 1:1 and the dashed lines are within a factor of 10. Bottom panel: probability distributions of the difference between the deblended fluxes and ALMA measurements normalised by the 1σ flux uncertainty, for sources with ALMA measured fluxes >4 mJy.
Current usage metrics show cumulative count of Article Views (full-text article views including HTML views, PDF and ePub downloads, according to the available data) and Abstracts Views on Vision4Press platform.
Data correspond to usage on the plateform after 2015. The current usage metrics is available 48-96 hours after online publication and is updated daily on week days.
Initial download of the metrics may take a while.