Fig. 14
Download original image
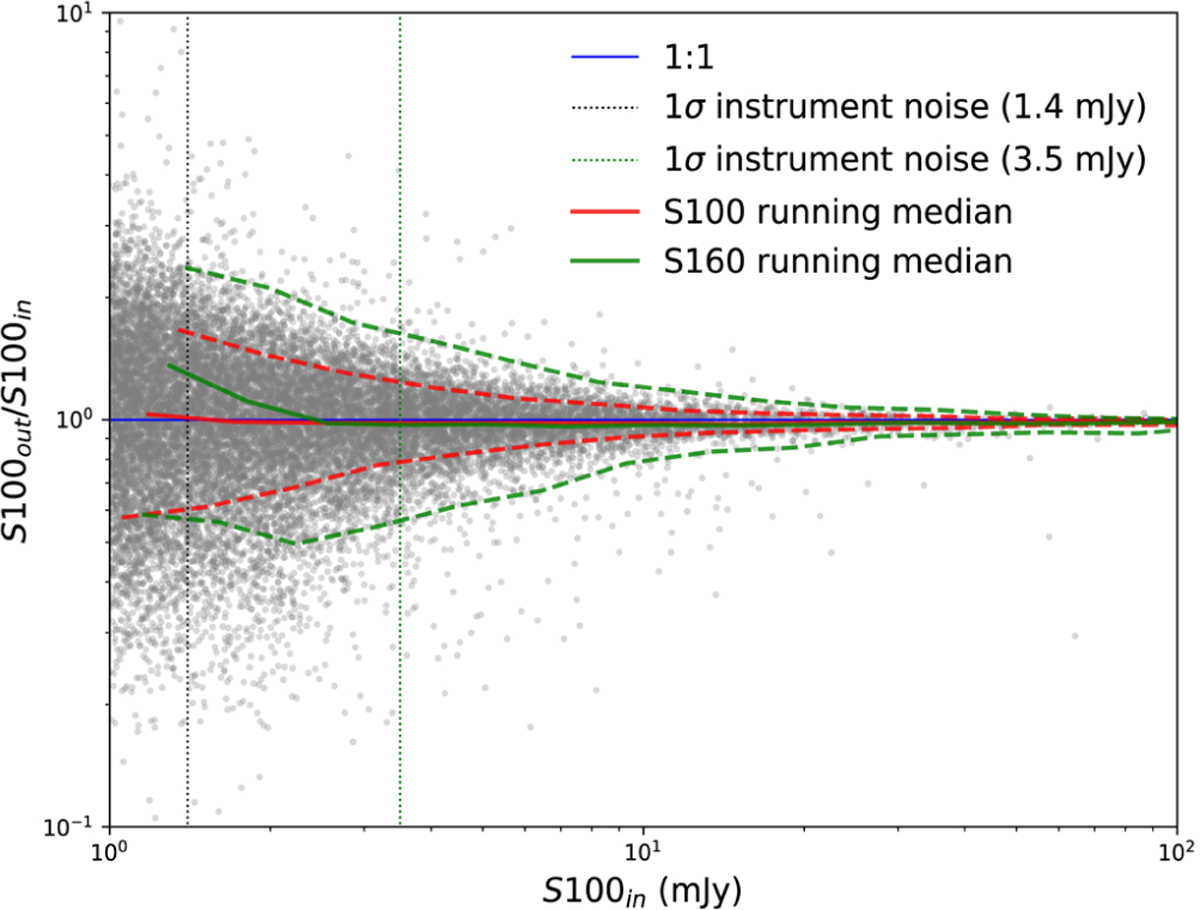
Ratio of the output XID+ flux to the input flux vs. the input flux at 100 μm, down to the flux cut of 1 mJy. The blue line is the one-to- one correspondence. The black and green vertical dotted line corresponds to the 1σ instrument noise level of 1.4 and 3.5 mJy at 100 and 160 μm respectively. The red/green solid line is the running median at 100/160 μm. The red/green dashed lines are the 16th and 84th percentiles at 100/160 μm.
Current usage metrics show cumulative count of Article Views (full-text article views including HTML views, PDF and ePub downloads, according to the available data) and Abstracts Views on Vision4Press platform.
Data correspond to usage on the plateform after 2015. The current usage metrics is available 48-96 hours after online publication and is updated daily on week days.
Initial download of the metrics may take a while.