Open Access
Fig. 11
Download original image
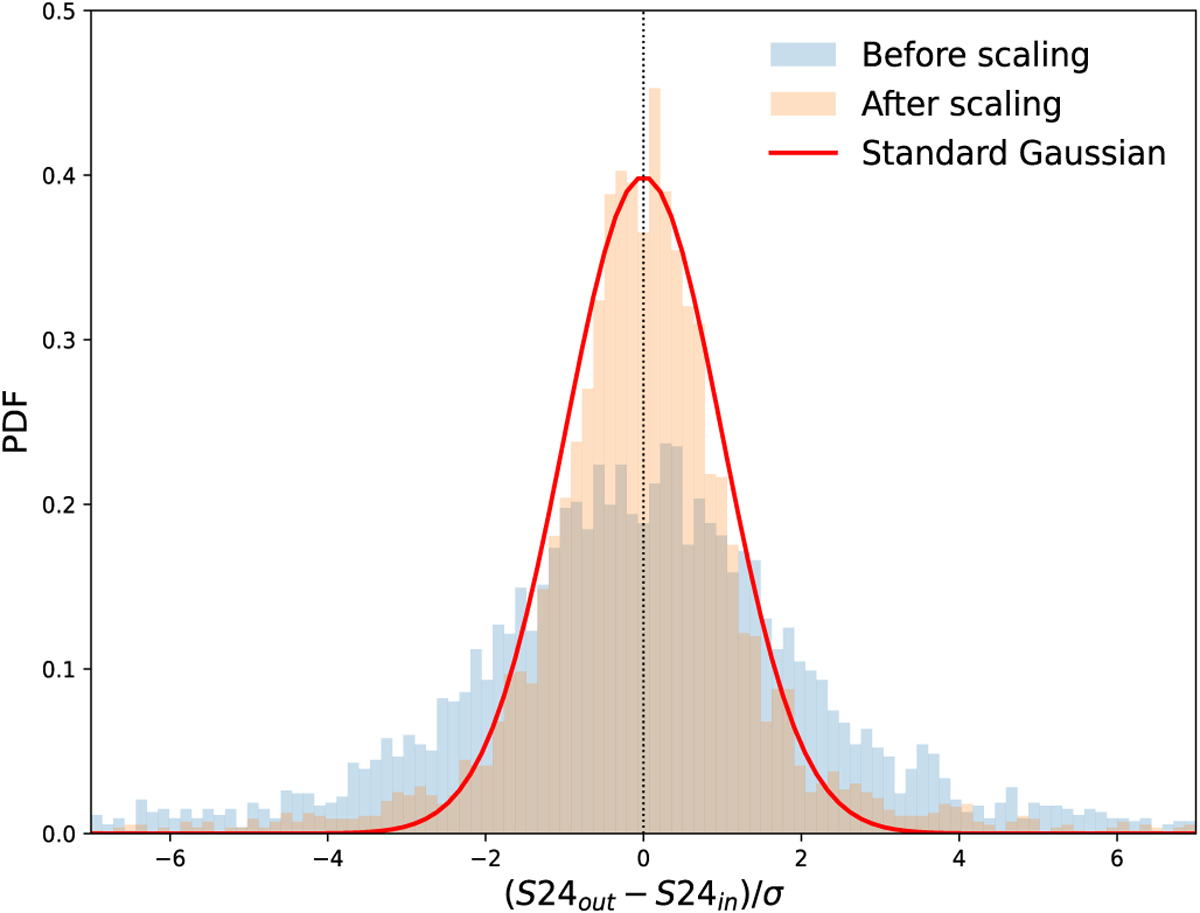
Distribution of the flux difference (between the output XID+ flux and the true flux) normalised by the XID+ flux uncertainty estimate, before and after multiplying the 1σ uncertainty by a factor of two. The red line corresponds to a standard Gaussian.
Current usage metrics show cumulative count of Article Views (full-text article views including HTML views, PDF and ePub downloads, according to the available data) and Abstracts Views on Vision4Press platform.
Data correspond to usage on the plateform after 2015. The current usage metrics is available 48-96 hours after online publication and is updated daily on week days.
Initial download of the metrics may take a while.