Fig. 8
Download original image
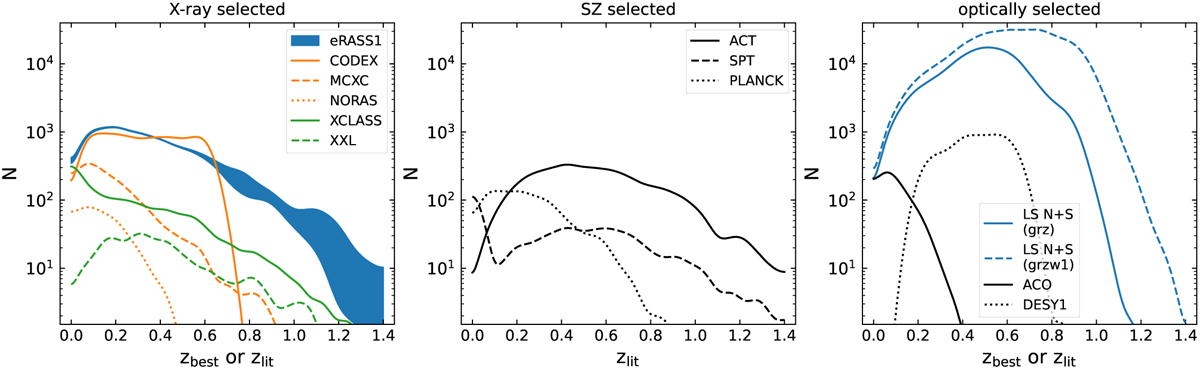
Number of clusters per redshift interval Δzλ = 0.05. For catalogs created in this work (blue), we used the best redshift zbest, and for literature catalogs, we used the published redshift zlit. Each panel refers to a different cluster selection method. The smoothed histograms were obtained by summing over the redshift posteriors of all clusters. For better visibility, the distributions were additionally smoothed with a Gaussian kernel with a standard deviation Δzλ = 0.04. For the eRASS1 catalog, the upper border of the filled region refers to all 12 247 clusters, and the lower border refers to the subset of 10 959 clusters with zλ < zvlim. A richness cut λnorm > 16 and a limiting redshift cut zλ < zvlim were only applied to the optically selected combined LS DR10 south and LS DR9 north catalogs (LS N+S). That makes them comparable to the DES year 1 catalog, which has a consistent richness cut of λ > 20 applied (see Sec. 5.4).
Current usage metrics show cumulative count of Article Views (full-text article views including HTML views, PDF and ePub downloads, according to the available data) and Abstracts Views on Vision4Press platform.
Data correspond to usage on the plateform after 2015. The current usage metrics is available 48-96 hours after online publication and is updated daily on week days.
Initial download of the metrics may take a while.