Fig. 5
Download original image
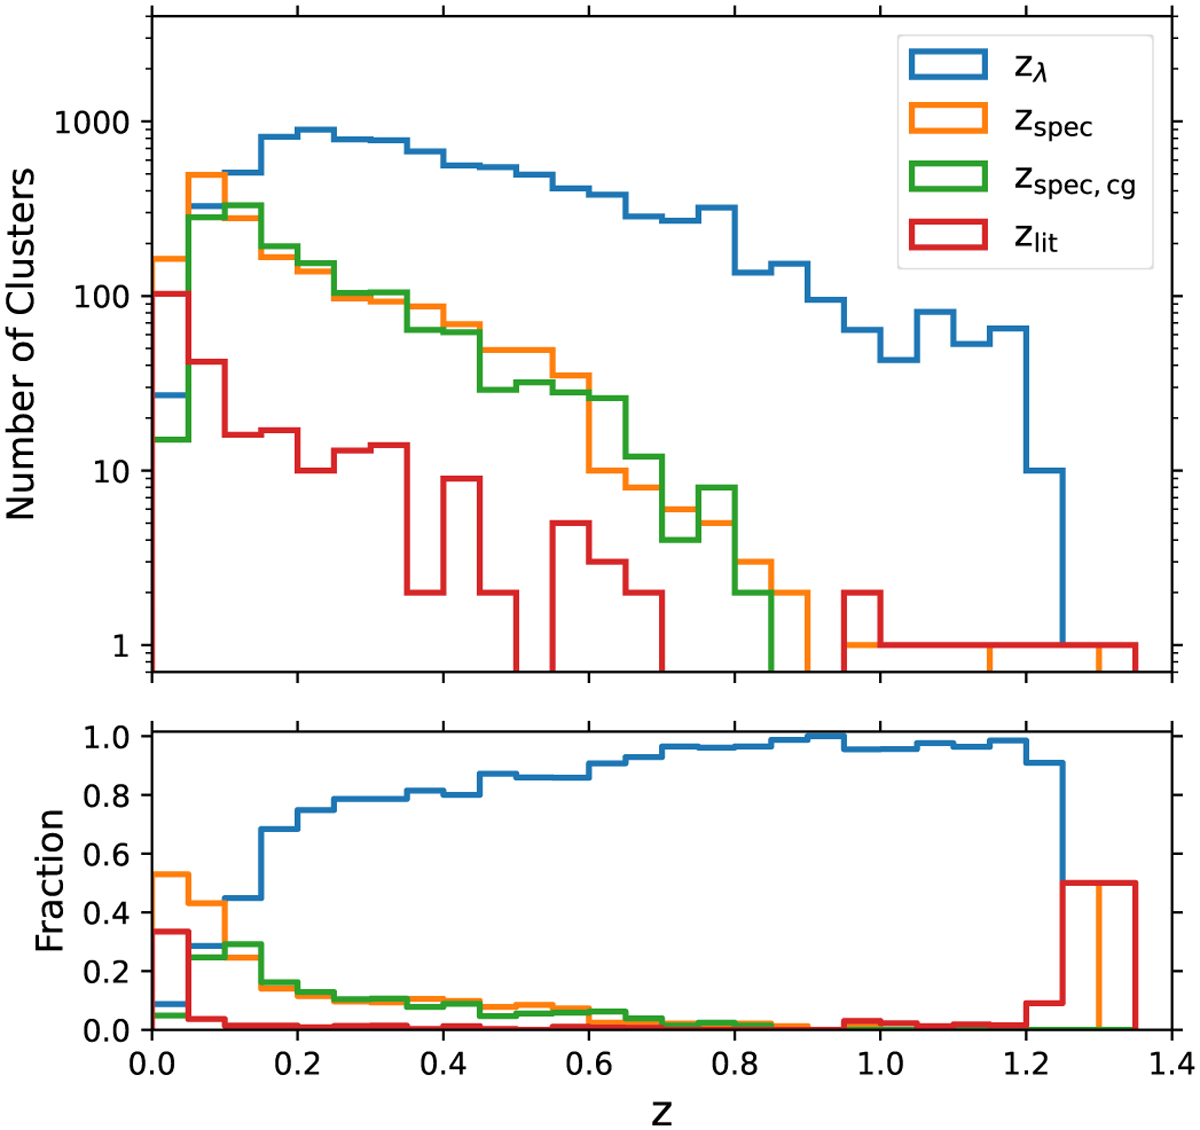
Number (top panel) and relative fraction (bottom panel) of eRASS1 clusters per redshift bin depending on their best redshift type. The total numbers are 8790 photometric redshifts (zλ, Sec. 3.2), 1759 spectroscopic redshifts determined using the bootstrap method (zspec, Sec. 3.3), 1451 spectroscopic redshifts of the galaxy at the optical center (zspec,cg, Sec. 3.3), and 247 literature redshifts (zlit, Sec. 3.4). Clusters with unflagged velocity dispersion information (Sec. 3.6) have the same distribution as the zspec sample.
Current usage metrics show cumulative count of Article Views (full-text article views including HTML views, PDF and ePub downloads, according to the available data) and Abstracts Views on Vision4Press platform.
Data correspond to usage on the plateform after 2015. The current usage metrics is available 48-96 hours after online publication and is updated daily on week days.
Initial download of the metrics may take a while.