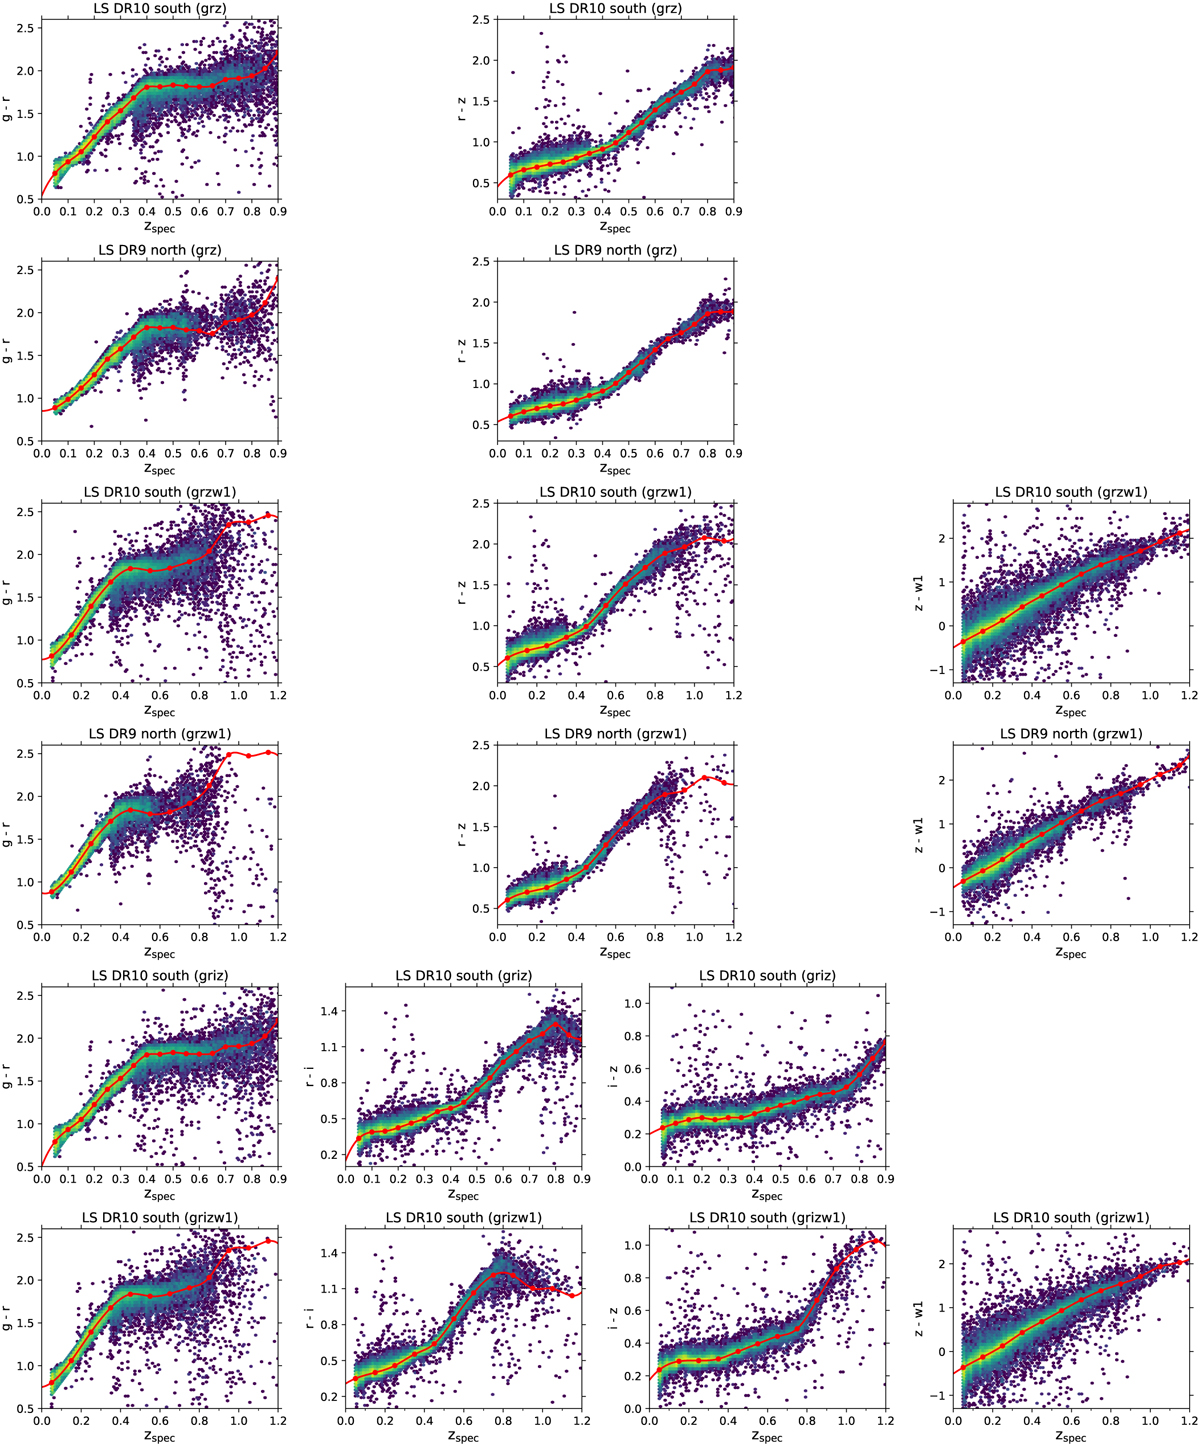
Fig. C.1
Download original image
Red-sequence models for the six different calibrations (rows). Each filter band combination and LS parts are labeled in the titles of the subpanels. The combination of n filter bands results in red-sequence models for n − 1 colors (columns). The red-sequence models are shown by the red splines and red points mark the spline nodes. The training galaxies are color-coded according to their point density. Their total numbers are, after clipping, ~93 000 for LS DR10 (grz and grzw1), ~72000 for LS DR10 (griz and grizw1), and ~36000 for LS DR9 north (grz and grzw1).
Current usage metrics show cumulative count of Article Views (full-text article views including HTML views, PDF and ePub downloads, according to the available data) and Abstracts Views on Vision4Press platform.
Data correspond to usage on the plateform after 2015. The current usage metrics is available 48-96 hours after online publication and is updated daily on week days.
Initial download of the metrics may take a while.