Fig. 2
Download original image
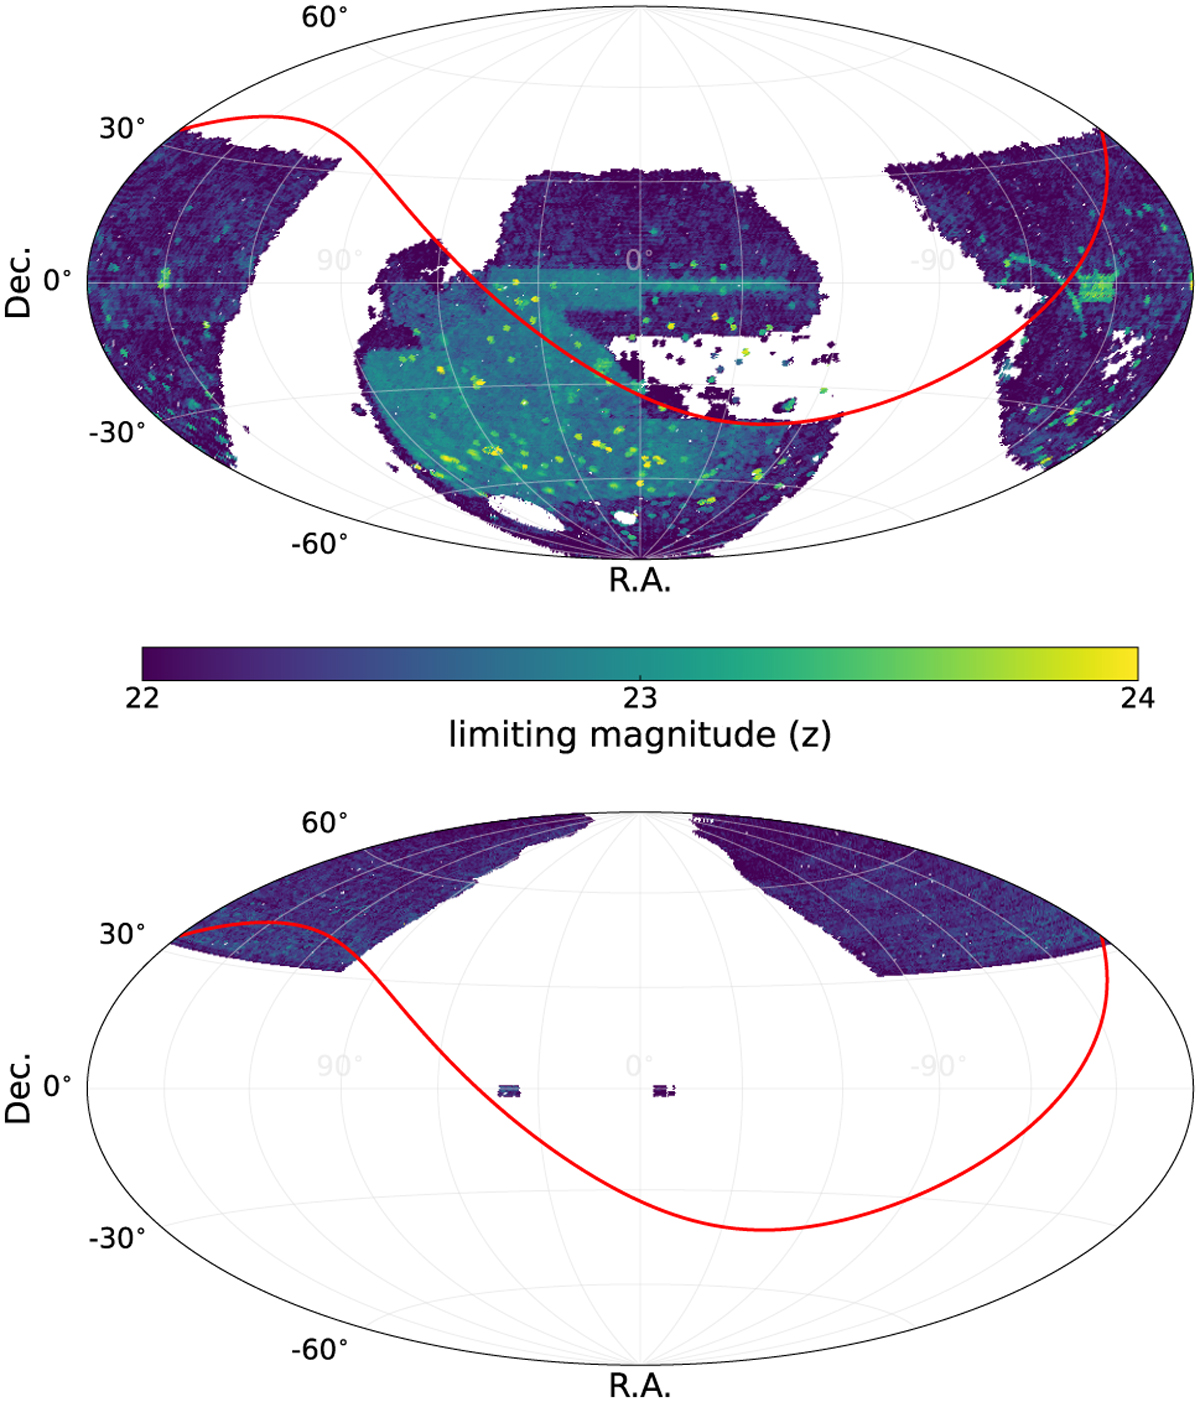
Maps of the limiting magnitude in the z band for sources detected with 10σ significance. The footprint maps show the coverage for the Legacy Surveys DR10 south (top panel) and DR9 north (bottom panel). Only regions with data in all the g-, r-, and z-bands were considered. The half sky that is covered by eRASS1 corresponds to the region below the red line. The limiting magnitudes in the z band directly translate to the limiting redshift zvlim (see Appendix B for details).
Current usage metrics show cumulative count of Article Views (full-text article views including HTML views, PDF and ePub downloads, according to the available data) and Abstracts Views on Vision4Press platform.
Data correspond to usage on the plateform after 2015. The current usage metrics is available 48-96 hours after online publication and is updated daily on week days.
Initial download of the metrics may take a while.