Fig. 18
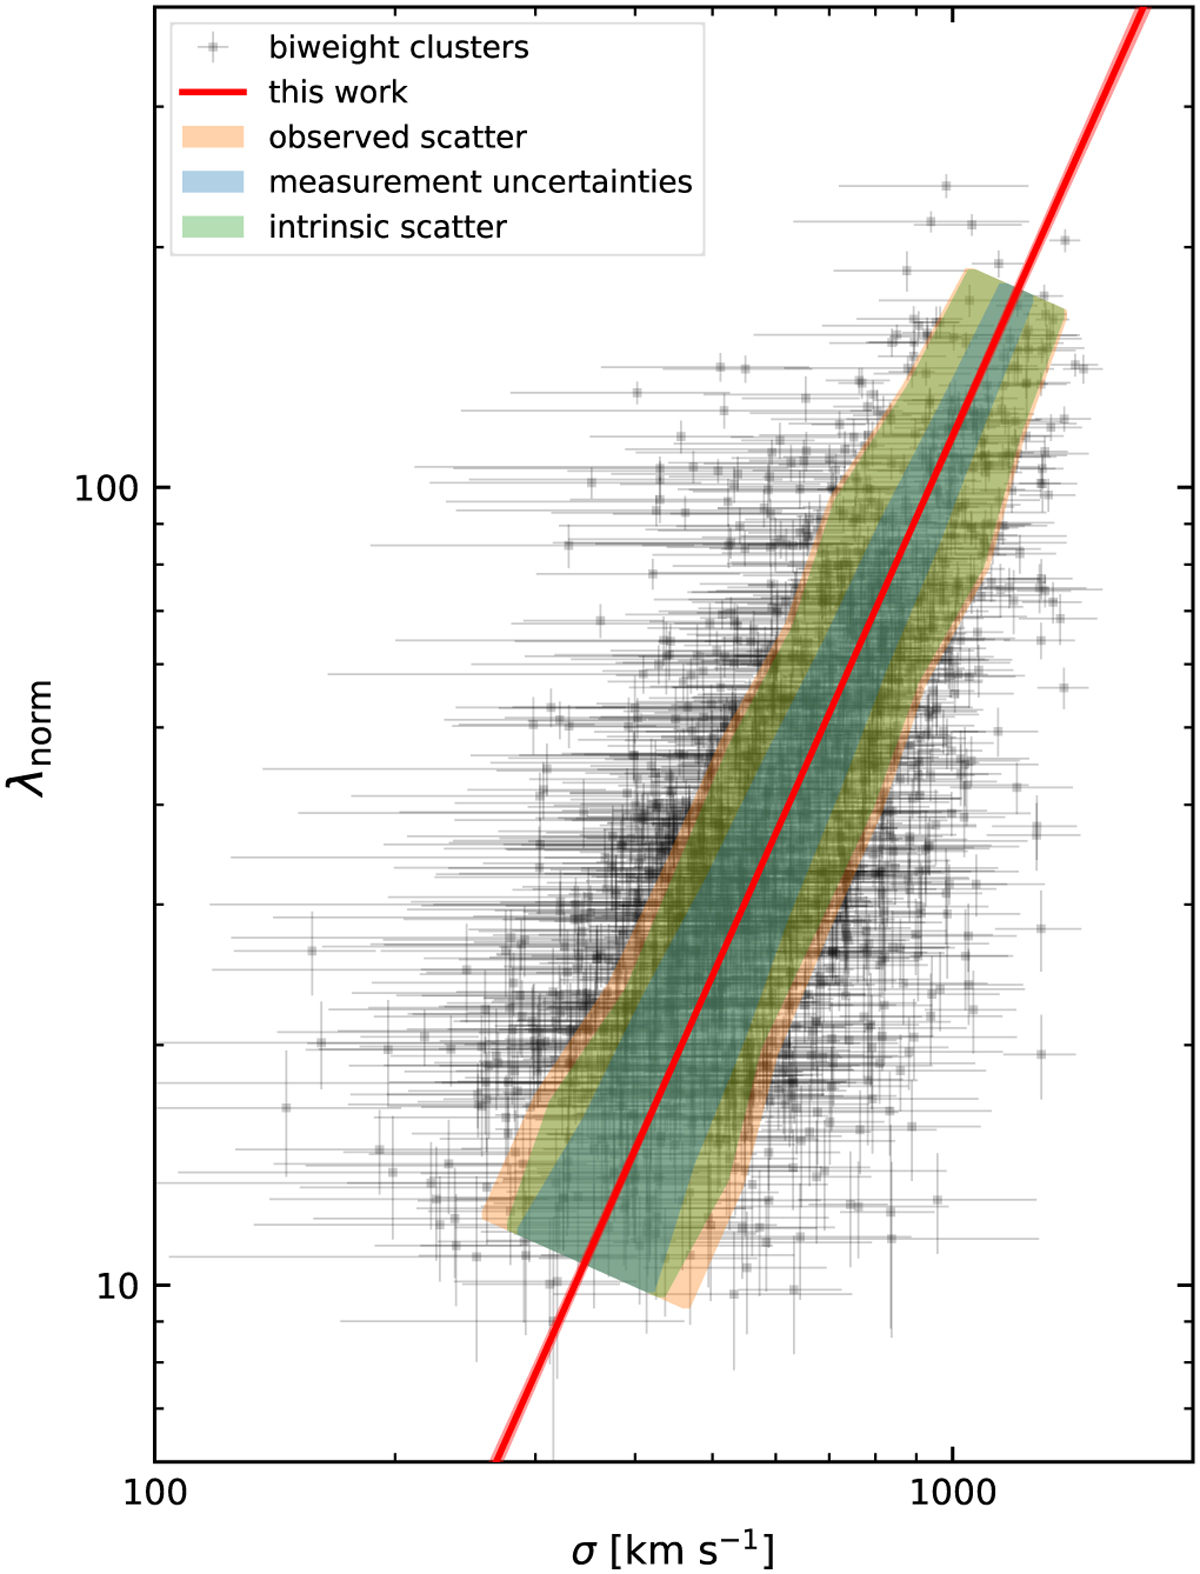
Download original image
Relation for cluster line-of-sight velocity dispersion σ and richness λnorm. The black data points are for all clusters in our analyzed catalogs (see Table 4) apart from the blind-mode runs. In total, 1699 clusters with Nmembers ≥ 15 spectroscopic members were selected. The red line is the best fit to the data, and the light red shades show the uncertainty of the relation. The observed scatter δobs,orth (orange) was measured orthogonal to the best-fit relation in 9 bins. The median orthogonal component of the measurement uncertainties δm,orth is shown for each bin in blue. By subtracting δm,orth from δobs,orth in quadrature, we estimated the intrinsic scatter δin for each bin. It is shown in green.
Current usage metrics show cumulative count of Article Views (full-text article views including HTML views, PDF and ePub downloads, according to the available data) and Abstracts Views on Vision4Press platform.
Data correspond to usage on the plateform after 2015. The current usage metrics is available 48-96 hours after online publication and is updated daily on week days.
Initial download of the metrics may take a while.