Fig. 16
Download original image
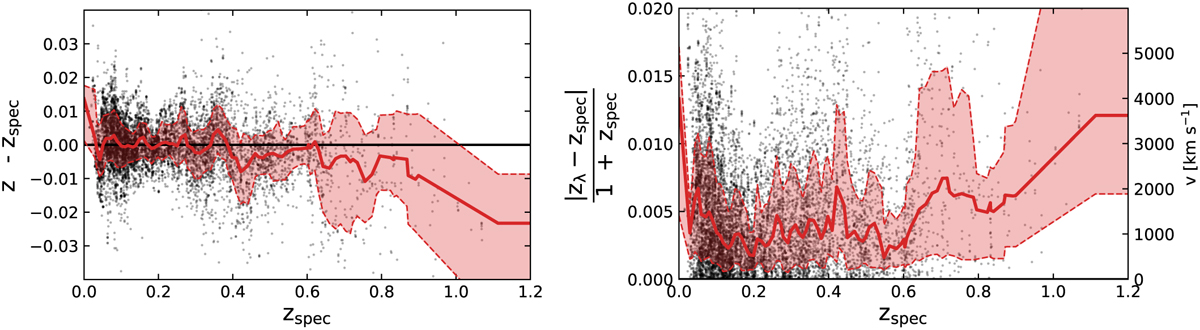
Bias and uncertainty of the photometric cluster redshifts zλ estimated by comparing to high-quality spectroscopic cluster redshifts zspec. Black points refer to 9522 clusters with high-quality spectroscopic redshifts (see Sect. 8). The catalogs were merged as described in Sect. 4.1.1. The red line is the running median, and the red shaded regions give the uncertainty δzλ taken as the 16th and 84th percentiles of the distribution. In the left panel, the continuous red line is the redshift bias Δzλ, and the dashed lines give the redshift uncertainty δzλ. The right panel shows the absolute errors normalized by 1 + zspec, which is proportional to the line-of-sight velocity v (Eq. (6)).
Current usage metrics show cumulative count of Article Views (full-text article views including HTML views, PDF and ePub downloads, according to the available data) and Abstracts Views on Vision4Press platform.
Data correspond to usage on the plateform after 2015. The current usage metrics is available 48-96 hours after online publication and is updated daily on week days.
Initial download of the metrics may take a while.