Open Access
Fig. 14
Download original image
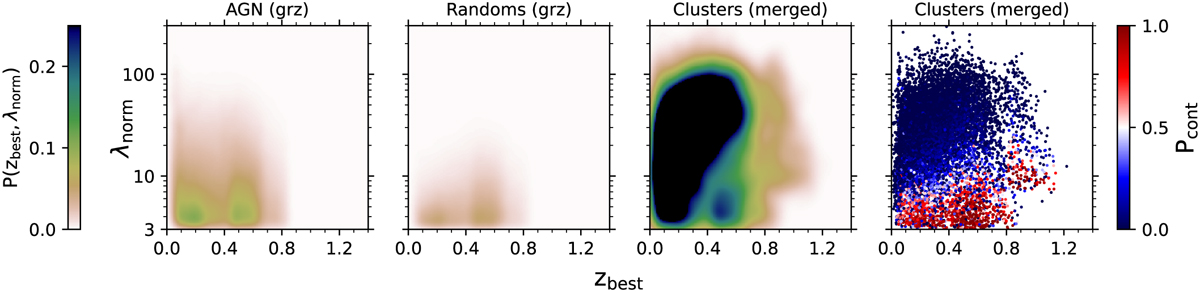
Kernel density estimates of AGNs, random points, and clusters in redshift (zbest)–richness (λnorm) space (first three panels). The right panel shows the individual cluster data points color-coded by their probability of being a contaminant.
Current usage metrics show cumulative count of Article Views (full-text article views including HTML views, PDF and ePub downloads, according to the available data) and Abstracts Views on Vision4Press platform.
Data correspond to usage on the plateform after 2015. The current usage metrics is available 48-96 hours after online publication and is updated daily on week days.
Initial download of the metrics may take a while.