Fig. 12
Download original image
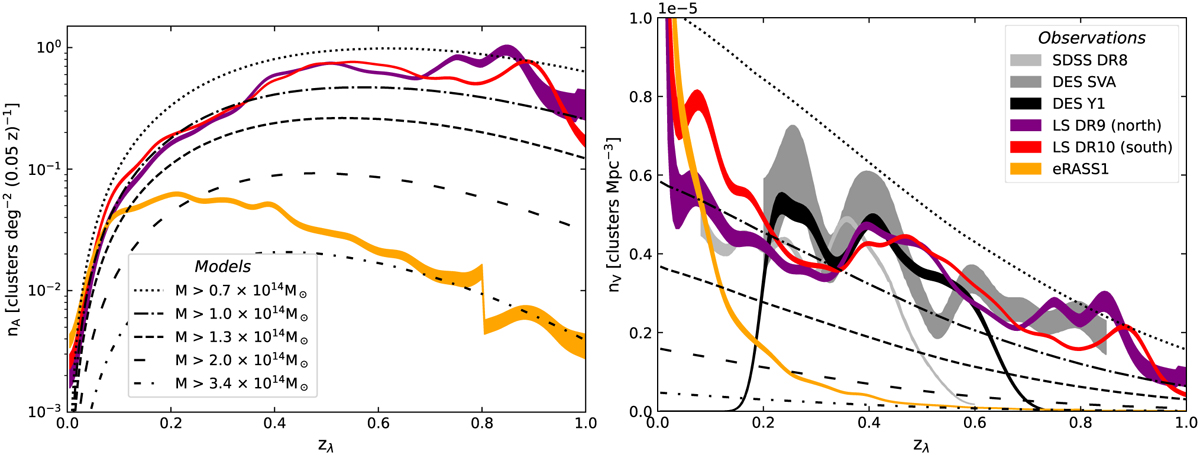
Cluster number density per sky area (left) and comoving volume (right) against redshift. Red and purple lines refer to clusters detected using the eROMaPPer blind mode on the LS DR10 south and LS DR9 north, respectively, in the grz filter band combination. We restricted the samples to a reliable redshift range zλ < zvlim. The orange line refers to the eRASS1 clusters. A discontinuity at zλ = 0.8 arises from the merging of the low-z-optimized and high-z-optimized eROMaPPer runs (see Sect. 4.1.1). A richness cut of λnorm > 16 was applied only to the LS DR9 north and LS DR10 south catalogs. Volume densities for the SDSS DR8 and DES SVA catalogs were adopted from Rykoff et al. (2016) and for DES year 1, calculated assuming a survey area of 1437 deg2 with uniform depth (see Table 4). The curves were normalized for a bin size of Δz = 0.05 and smoothed using a Gaussian kernel with a standard deviation of Δz = 0.02. The width of the lines corresponds to the Poissonian error for the same bin size, consistently as in Rykoff et al. (2016).
Current usage metrics show cumulative count of Article Views (full-text article views including HTML views, PDF and ePub downloads, according to the available data) and Abstracts Views on Vision4Press platform.
Data correspond to usage on the plateform after 2015. The current usage metrics is available 48-96 hours after online publication and is updated daily on week days.
Initial download of the metrics may take a while.