Fig. 8.
Download original image
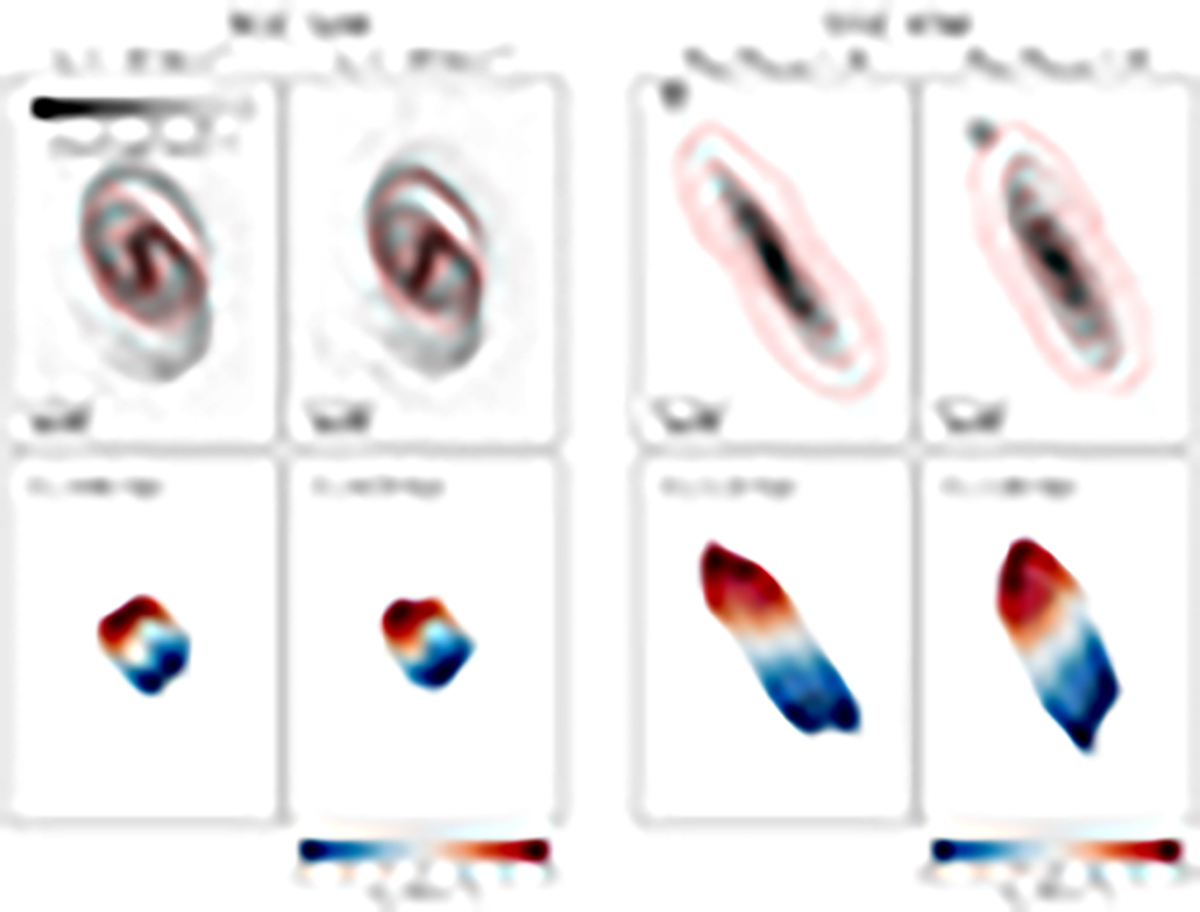
First two columns of panels: stellar surface brightness maps (top) and line-of-sight velocity field (bottom) from two additional simulations of NGC 5238 discussed in Sect. 4.3. The columns, from left to right, show the simulations with initial velocities vx = −10 km s−1 and vx = −20 km s−1, respectively. The mock surface brightness and velocity field maps are obtained as in Figs. 4 and 5. Second two columns of panels: same as the first two columns, but for UGC 8760. In this case, instead of showing two different simulations, the columns show the same simulation but at different snapshots that both replicate the galaxy observed structure and kinematics. The merger mass ratio of the simulation is Mdm/Mdm, sat = 24.
Current usage metrics show cumulative count of Article Views (full-text article views including HTML views, PDF and ePub downloads, according to the available data) and Abstracts Views on Vision4Press platform.
Data correspond to usage on the plateform after 2015. The current usage metrics is available 48-96 hours after online publication and is updated daily on week days.
Initial download of the metrics may take a while.