Fig. 6.
Download original image
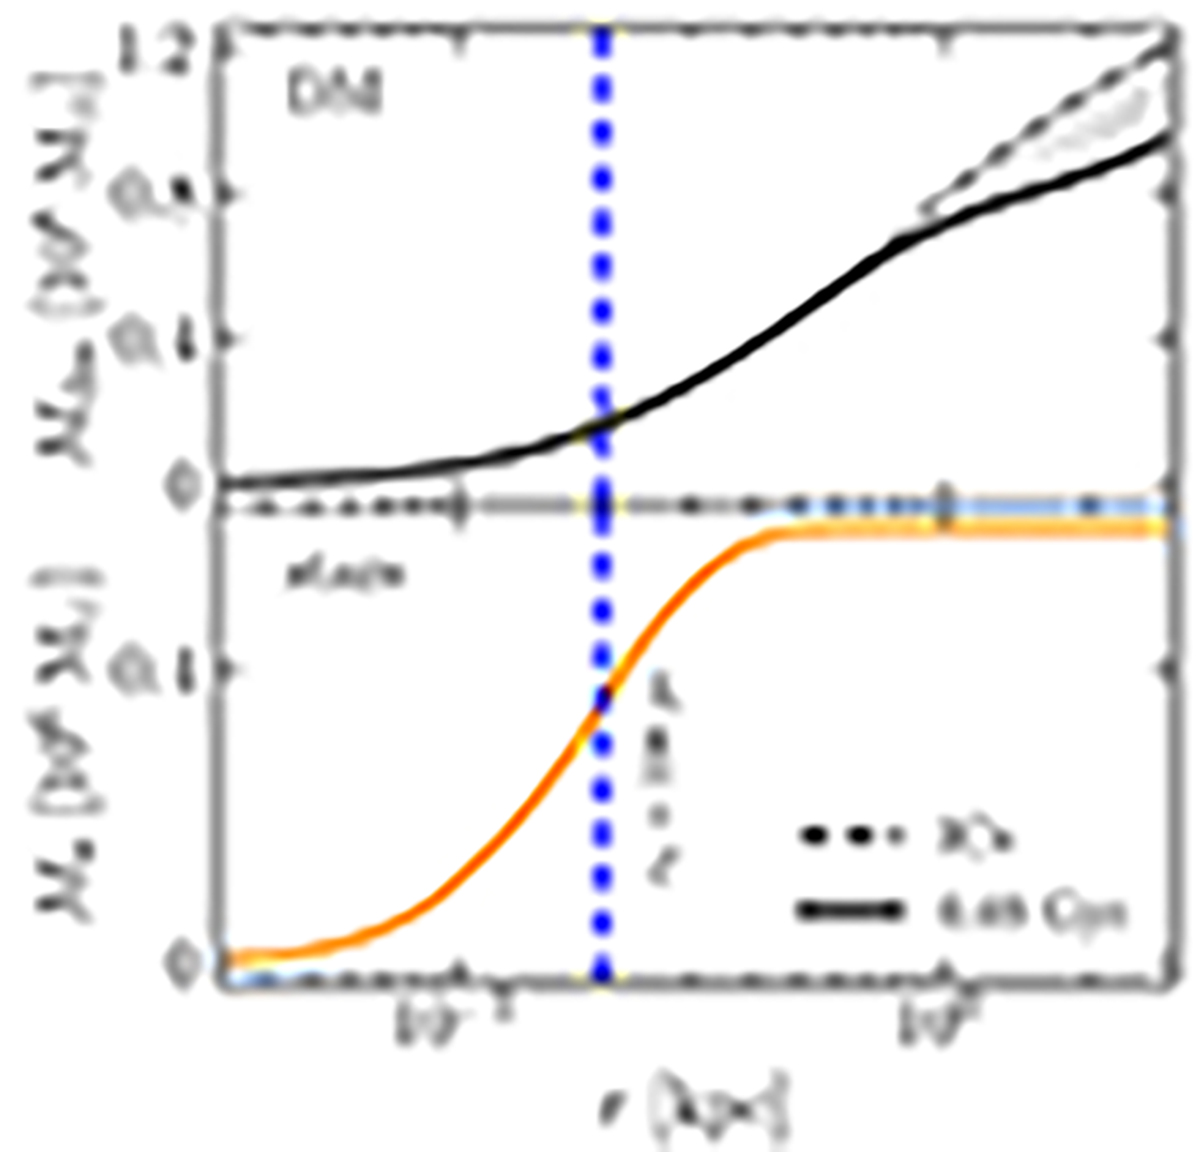
Top panel: dark matter mass distribution of the satellite of UGC 8760 as a function of the distance from the satellite center. The black-dashed line shows the mass distribution as in the ICs while the black solid after t = 0.69 Gyr. Bottom panel: same as in the top panel but showing the mass distribution of the stellar component on the satellite. The dashed blue line marks the position of the stellar component half-mass radius. The stellar mass distribution does not change from the ICs to 0.69 Gyr.
Current usage metrics show cumulative count of Article Views (full-text article views including HTML views, PDF and ePub downloads, according to the available data) and Abstracts Views on Vision4Press platform.
Data correspond to usage on the plateform after 2015. The current usage metrics is available 48-96 hours after online publication and is updated daily on week days.
Initial download of the metrics may take a while.