Fig. 5.
Download original image
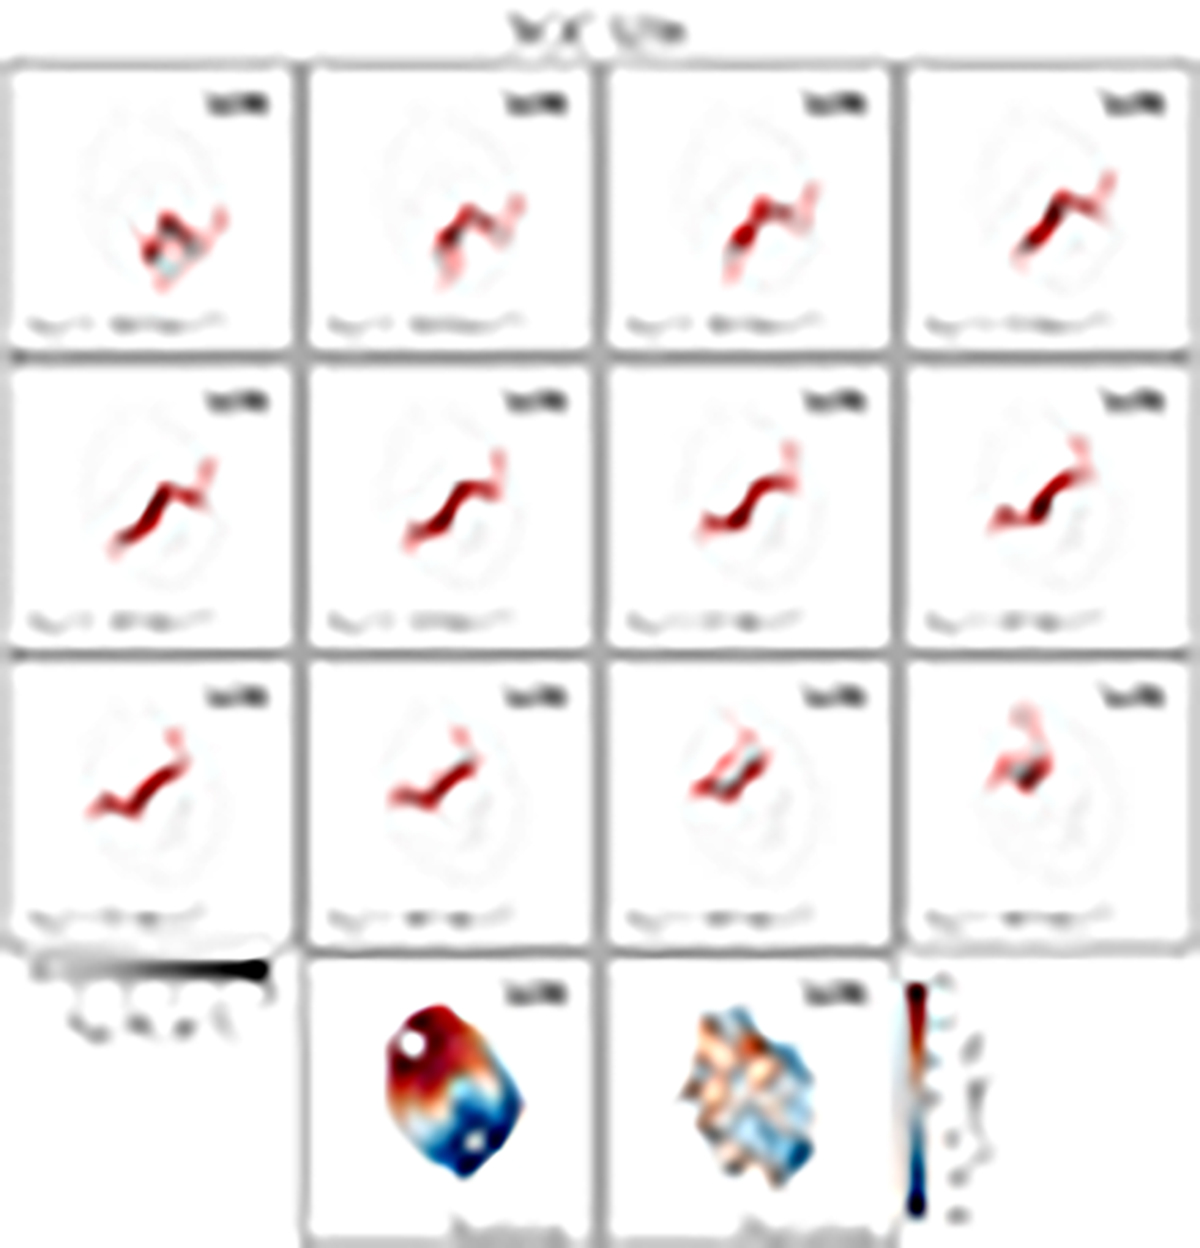
Channel maps of H I gas distribution of NGC 5238 computed from the reference simulations of Sect. 4. The channels width is 3 km s−1, with the average channel velocity reported in each panel. The red curves show H I column densities of 0.5, 2 and 8 M⊙ pc−2 while, in black, the same 0.5, 2 and 8 M⊙ pc−2 isodensities but computed from the total gas distribution. The bottom panels show the overall gas-mass weighted line-of-sight velocity field in the simulation (left) and in the VLA observation (Cannon et al. 2016): blue colors and negative velocities correspond to the disc approaching arm, while red colors and positive velocities to the disc receding arm. The velocity field in the simulation extends down to column densities of 0.5 M⊙ pc−2. The panel size is 5.5 kpc × 5.5 kpc.
Current usage metrics show cumulative count of Article Views (full-text article views including HTML views, PDF and ePub downloads, according to the available data) and Abstracts Views on Vision4Press platform.
Data correspond to usage on the plateform after 2015. The current usage metrics is available 48-96 hours after online publication and is updated daily on week days.
Initial download of the metrics may take a while.