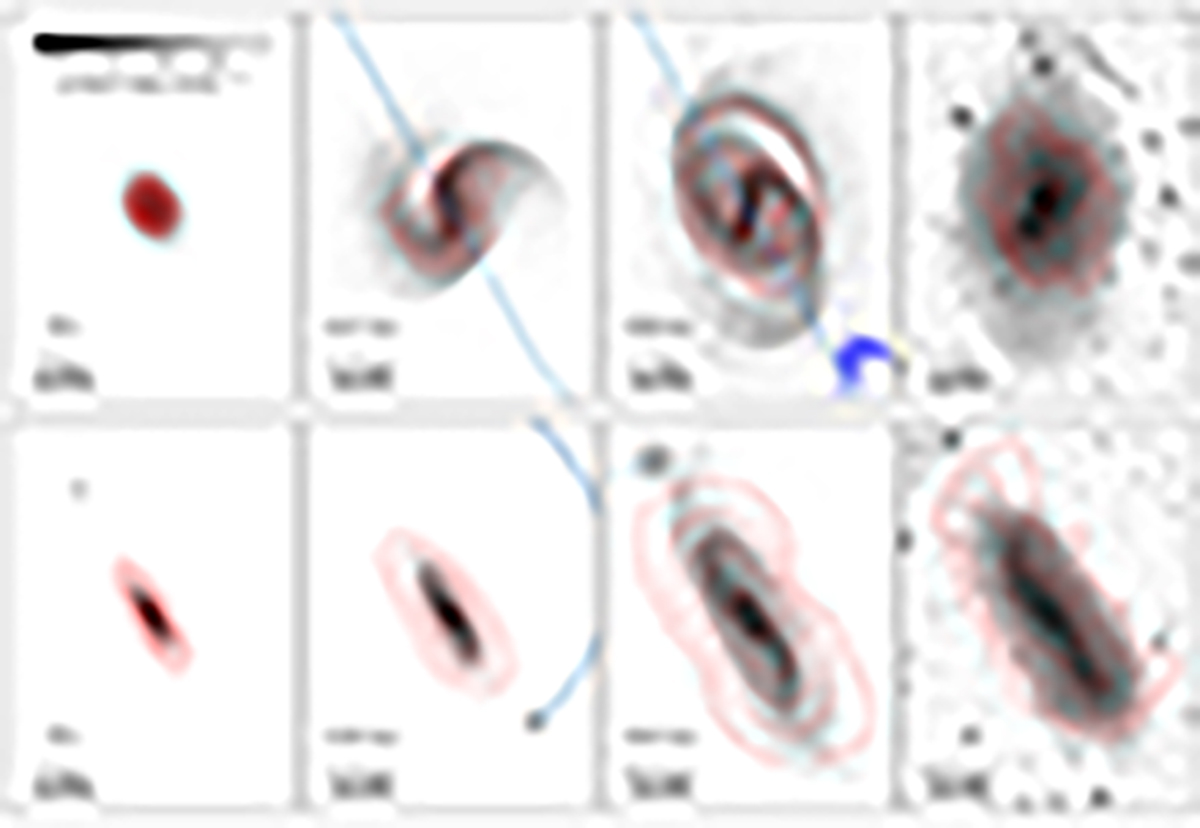
Fig. 4.
Download original image
Comparison between simulations and observations. First row of panels: stellar surface brightness maps from the reference simulation of NGC 5238 and the corresponding LBT observation. The left panel shows the ICs of the simulation, while the middle panels are subsequent snapshots (as reported in each panel). The third panel corresponds to the time when the simulation reproduces the data, shown for comparison in the rightmost panel. In the simulated maps, the pixel size is 0.225 arcsec × 0.225 arcsec (as for the LBC camera), and the maps have been convolved with a Gaussian beam of 1 arcsec FWHM to match the typical seeing during observations. To generate the maps, we adopted constant mass-to-light ratios and we set the surface brightness limit to 30 mag arcsec−2, to match the depth of the data. Blue lines show the orbit of the satellite, obtained by joining the centers of mass of its dark matter halo computed with the shrinking sphere method (Power et al. 2003). The color gradient indicates the direction of the orbit itself: the satellite moves from where the orbit is darker to where it is lighter. The red contours are levels of iso-H I column density, specifically 2k M⊙ pc−2, with k = 0, …, 3. Second row of panels: same as the top row but for the UGC 8760 system. For details on the simulation setup see Sect. 3.3 and Tables 1 and 2. In the top row, third panel, we highlight in blue the stellar particles belonging to the satellite of NGC 5238 as a comparison (see text for details).
Current usage metrics show cumulative count of Article Views (full-text article views including HTML views, PDF and ePub downloads, according to the available data) and Abstracts Views on Vision4Press platform.
Data correspond to usage on the plateform after 2015. The current usage metrics is available 48-96 hours after online publication and is updated daily on week days.
Initial download of the metrics may take a while.