Fig. 2.
Download original image
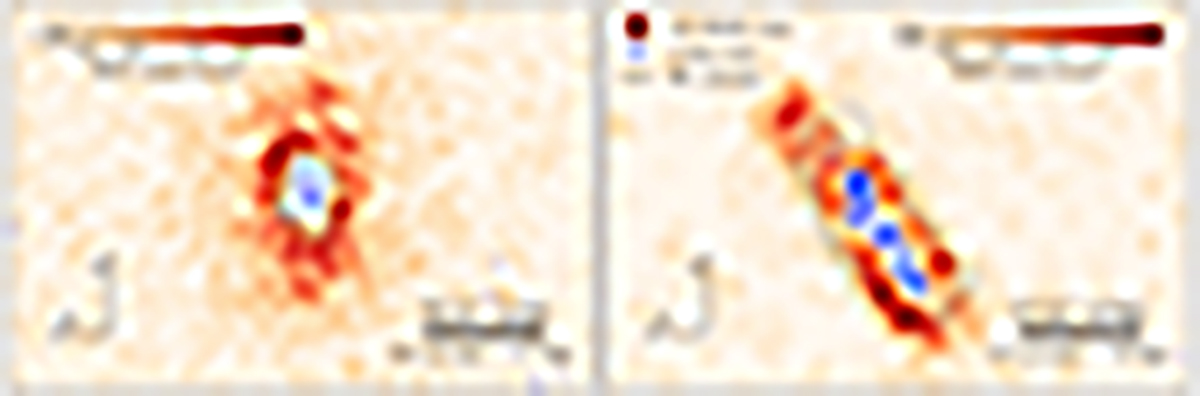
Spatial distribution of old (age > 2 Gyr) RGB stars and young (age ≲ 100 Myr) bright blue stars in NGC 5238 (left) and UGC 8760 (right). RGB maps are background-subtracted, and only pixels above a level of 3 times the background standard deviation (given by the vertical black segment in the colorbars) have been set to non-zero to mask density peaks due to red background galaxies. The blue points are individual young stars. H I contours at 1, 2, 4, 8 M⊙ pc−2 (same as in Fig. 1) are superimposed to the star count maps. North is up, east is to the left.
Current usage metrics show cumulative count of Article Views (full-text article views including HTML views, PDF and ePub downloads, according to the available data) and Abstracts Views on Vision4Press platform.
Data correspond to usage on the plateform after 2015. The current usage metrics is available 48-96 hours after online publication and is updated daily on week days.
Initial download of the metrics may take a while.