Fig. 1.
Download original image
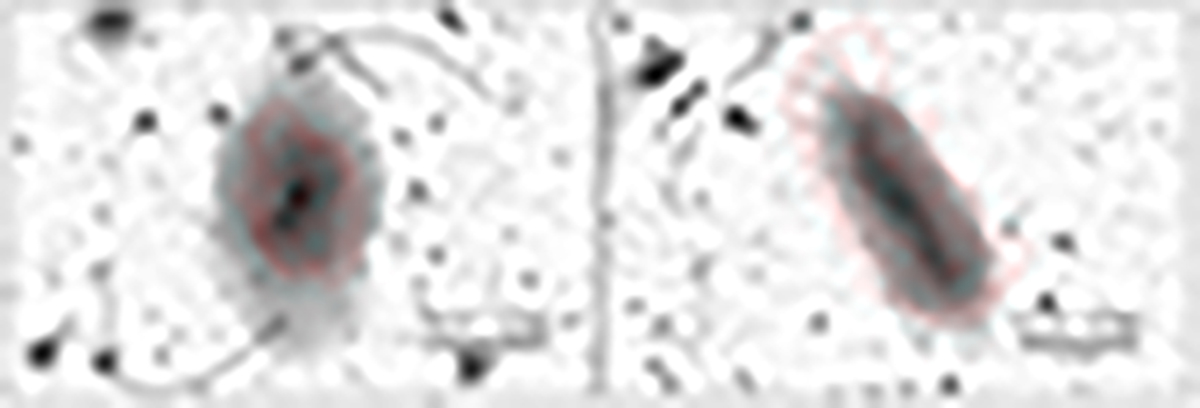
LBT images of NGC 5238 and UGC 8760. Left-hand panel: LBT g-band image of NGC 5238. The arrows show the positions of the northern and southern overdensities of stars while the red contours show lines of constant H I emission from VLA observations (Cannon et al. 2016) at the adopted distance. Right-hand panel: same as the left-hand panel but for UGC 8760. Here, the arrow shows the position of the northern overdensity of stars, while the VLA observations are from Begum et al. (2008). In both panels, the red contours correspond to 1, 2, 4, 8 M⊙ pc−2. North is up, east is to the left.
Current usage metrics show cumulative count of Article Views (full-text article views including HTML views, PDF and ePub downloads, according to the available data) and Abstracts Views on Vision4Press platform.
Data correspond to usage on the plateform after 2015. The current usage metrics is available 48-96 hours after online publication and is updated daily on week days.
Initial download of the metrics may take a while.