Fig. 14
Download original image
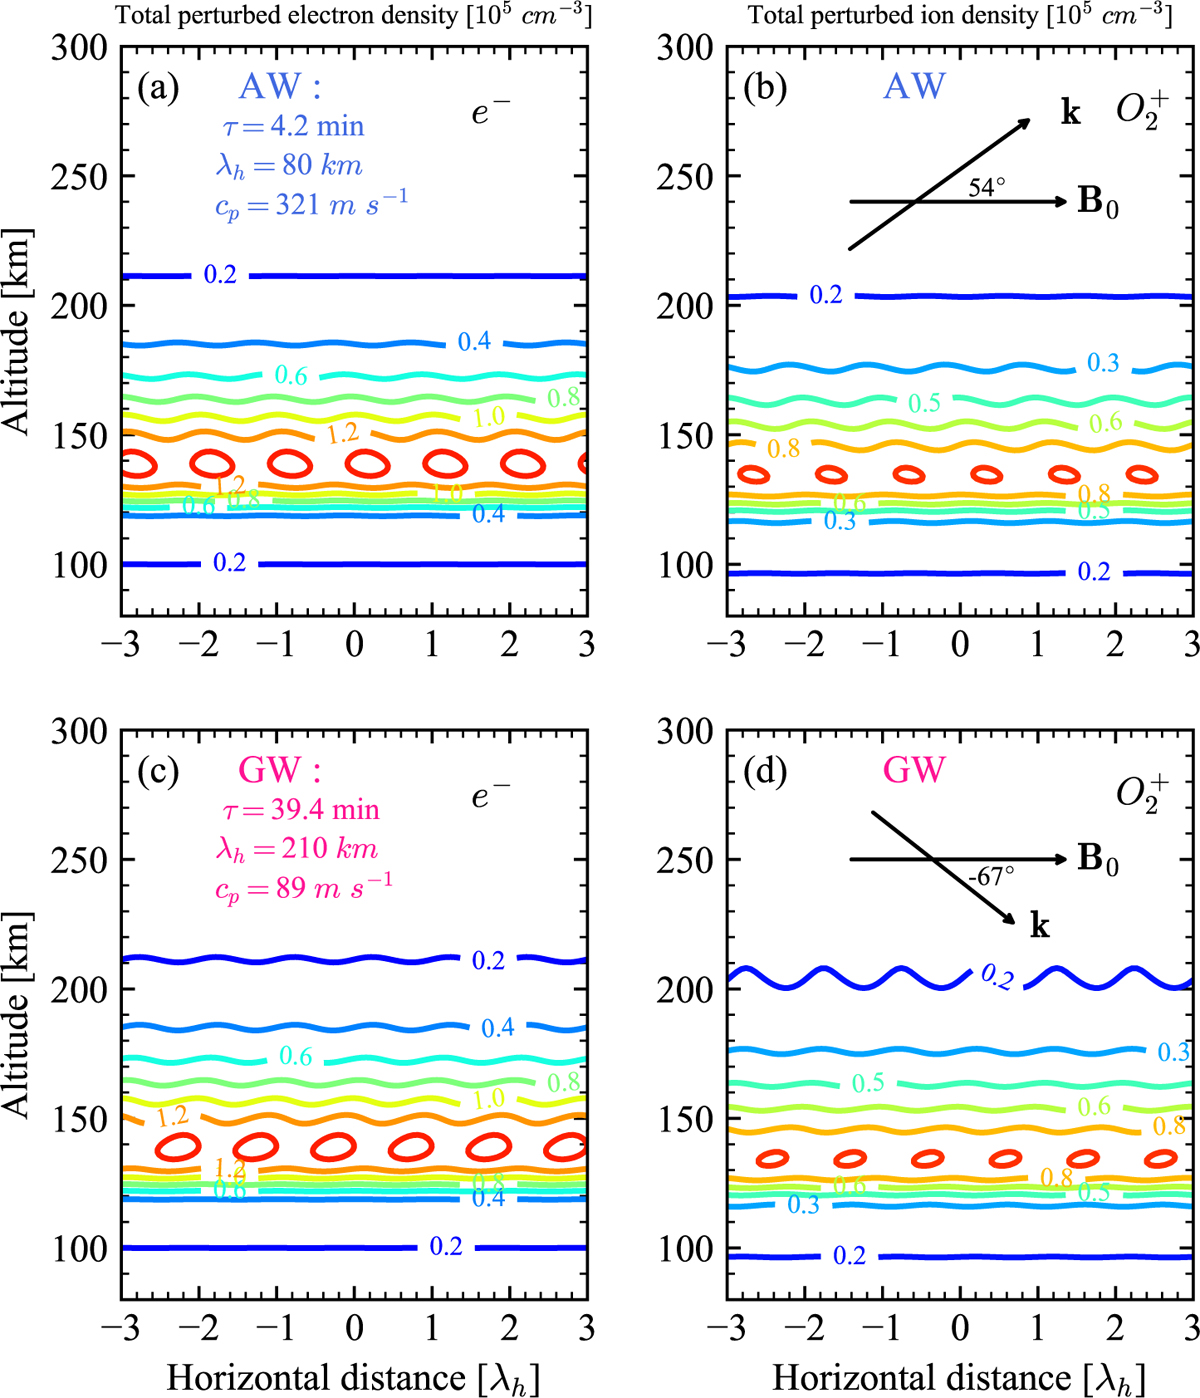
Spatial distributions of the total perturbed plasma density and associated with AW and GW wave modes are plotted in panels a-b and panels c-d, respectively. Iso-electronic contours driven by AW and GW modes are displayed in panels a and c, respectively. Perturbed density of the major ion constituent, ![]() , is only displayed. Panels b and d show iso-ionic density contours associated with the AW and GW modes, respectively. Numbers on the contour lines refer to the plasma number densities in units of 105 cm−3. Magnetic field vector, B0, and wavenumber vector, k, lie in the plane of the paper. Relative orientation between B0 and k for the AW and GW wave modes are shown in panels b and d, respectively. Angle between B0 and k is 54° for the AW wave mode and −67° for the GW wave mode.
, is only displayed. Panels b and d show iso-ionic density contours associated with the AW and GW modes, respectively. Numbers on the contour lines refer to the plasma number densities in units of 105 cm−3. Magnetic field vector, B0, and wavenumber vector, k, lie in the plane of the paper. Relative orientation between B0 and k for the AW and GW wave modes are shown in panels b and d, respectively. Angle between B0 and k is 54° for the AW wave mode and −67° for the GW wave mode.
Current usage metrics show cumulative count of Article Views (full-text article views including HTML views, PDF and ePub downloads, according to the available data) and Abstracts Views on Vision4Press platform.
Data correspond to usage on the plateform after 2015. The current usage metrics is available 48-96 hours after online publication and is updated daily on week days.
Initial download of the metrics may take a while.