Fig. 7
Download original image
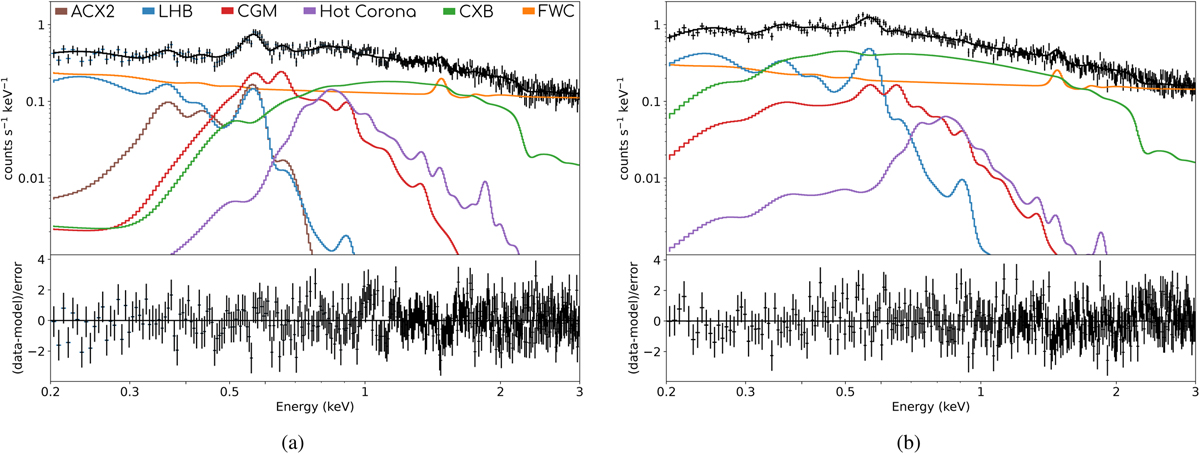
Background spectrum and fit model near the Galactic plane at b ~ 3.6° (a) and out of the plane at b ~ 22.1° (b). The data and total best-fit model are shown in black and the different model components are shown with the colors according to the legend in (a). For visual purposes only, the spectra were binned with a minimum 5σ or 50 counts per bin and for better visibility only the spectrum and model for TM1 is shown.
Current usage metrics show cumulative count of Article Views (full-text article views including HTML views, PDF and ePub downloads, according to the available data) and Abstracts Views on Vision4Press platform.
Data correspond to usage on the plateform after 2015. The current usage metrics is available 48-96 hours after online publication and is updated daily on week days.
Initial download of the metrics may take a while.