Open Access
Fig. 17
Download original image
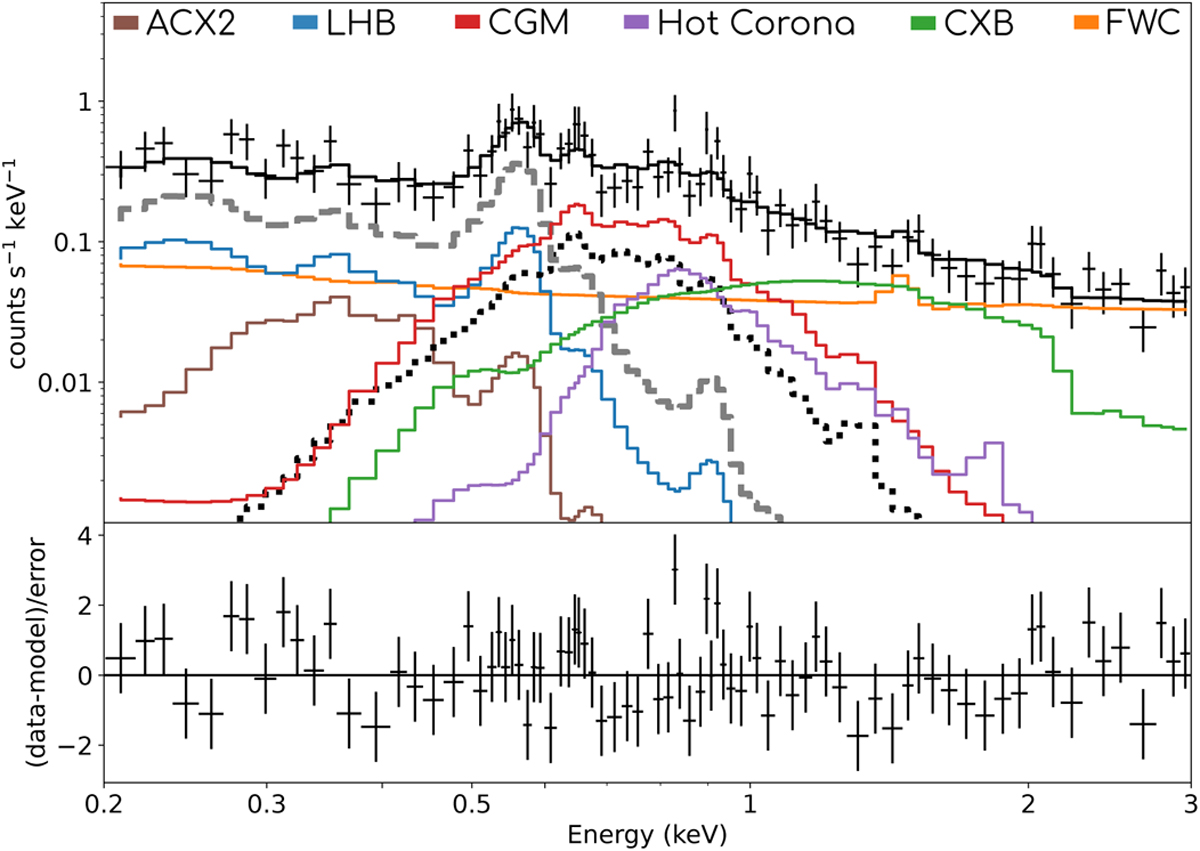
Spectrum and best-fit model for PKS 0646+06. The spectrum was rebinned visually with 3σ or 30 counts. The source model is TBABS × VNEI+APEC. The visual representation is similar to Fig. 11. The second source component (APEC) is shown with a thick, dashed gray line.
Current usage metrics show cumulative count of Article Views (full-text article views including HTML views, PDF and ePub downloads, according to the available data) and Abstracts Views on Vision4Press platform.
Data correspond to usage on the plateform after 2015. The current usage metrics is available 48-96 hours after online publication and is updated daily on week days.
Initial download of the metrics may take a while.