Fig. 13
Download original image
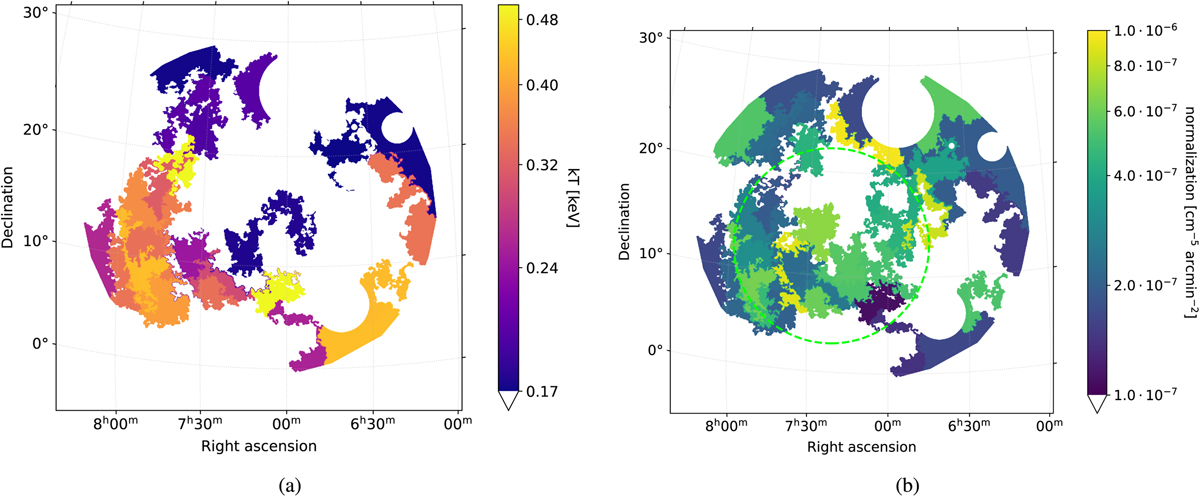
Spectral analysis results with the contour binning method. We used the TBABS × APEC + APEC model to account for the source emission. (a) the temperature kT and (b) the normalization of the first (absorbed) plasma component. The green dashed circle highlights the bins where we obtain significant contribution of the hotter plasma component. Regions below the threshold as indicated in the colorbar were made blank.
Current usage metrics show cumulative count of Article Views (full-text article views including HTML views, PDF and ePub downloads, according to the available data) and Abstracts Views on Vision4Press platform.
Data correspond to usage on the plateform after 2015. The current usage metrics is available 48-96 hours after online publication and is updated daily on week days.
Initial download of the metrics may take a while.