Fig. 12
Download original image
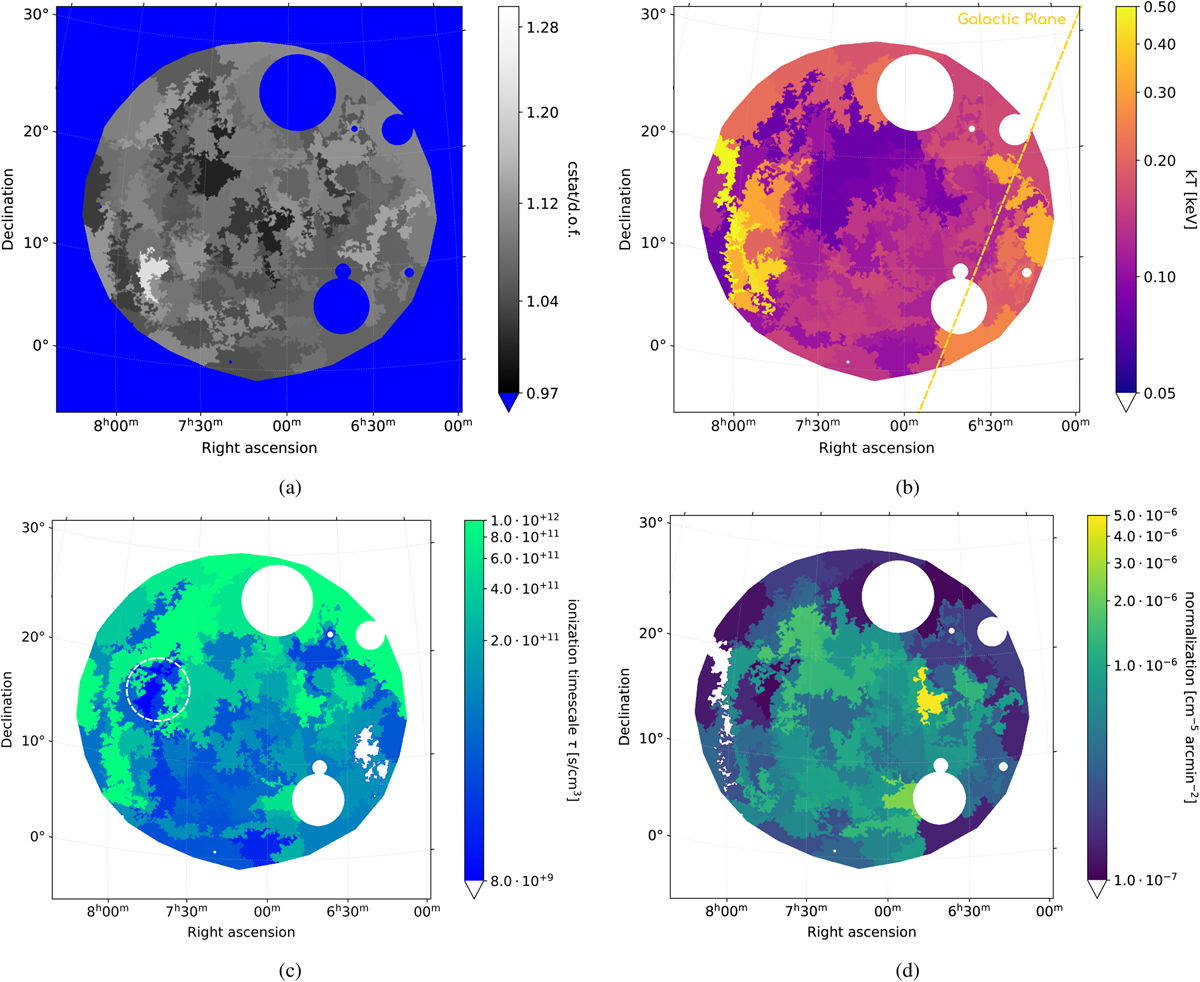
Spectral analysis results with the contour binning method. We used the TBABS × NEI model to account for the source emission. In (a) we show the red. fit statistic, in (b) the plasma temperature kT, in (c) the ionization timescale τ, and in (d) the normalization of the plasma component, normalized to the respective area of the bins for comparability.
Current usage metrics show cumulative count of Article Views (full-text article views including HTML views, PDF and ePub downloads, according to the available data) and Abstracts Views on Vision4Press platform.
Data correspond to usage on the plateform after 2015. The current usage metrics is available 48-96 hours after online publication and is updated daily on week days.
Initial download of the metrics may take a while.