Fig. 11
Download original image
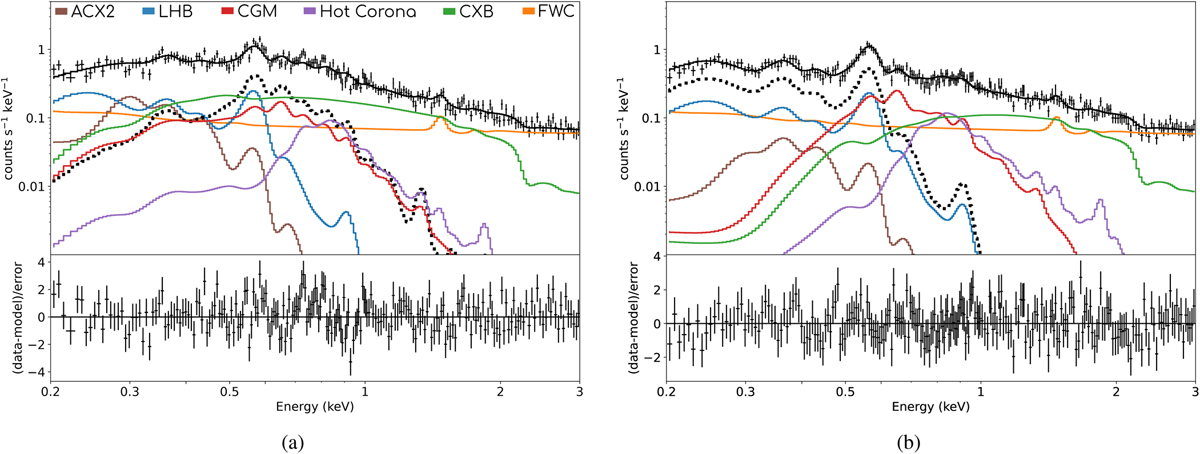
Two example spectra of contour bins with the best-fit model. We used the single NEI component model for the source. The background is approximated as described above, with the same colors for the various model components as shown in Fig. 7a. The source component is shown with a thick, dotted black line. In (a) we show the spectrum for a bin near the “arc_SE” region and in (b) near the “diffuse_S” region. The corresponding bins are also marked in Fig. 10. For visual purposes only, the spectra were binned with a minimum 5σ or 50 counts per bin and for better visibility only the spectrum and model for TM1 is shown.
Current usage metrics show cumulative count of Article Views (full-text article views including HTML views, PDF and ePub downloads, according to the available data) and Abstracts Views on Vision4Press platform.
Data correspond to usage on the plateform after 2015. The current usage metrics is available 48-96 hours after online publication and is updated daily on week days.
Initial download of the metrics may take a while.