Fig. 2.
Download original image
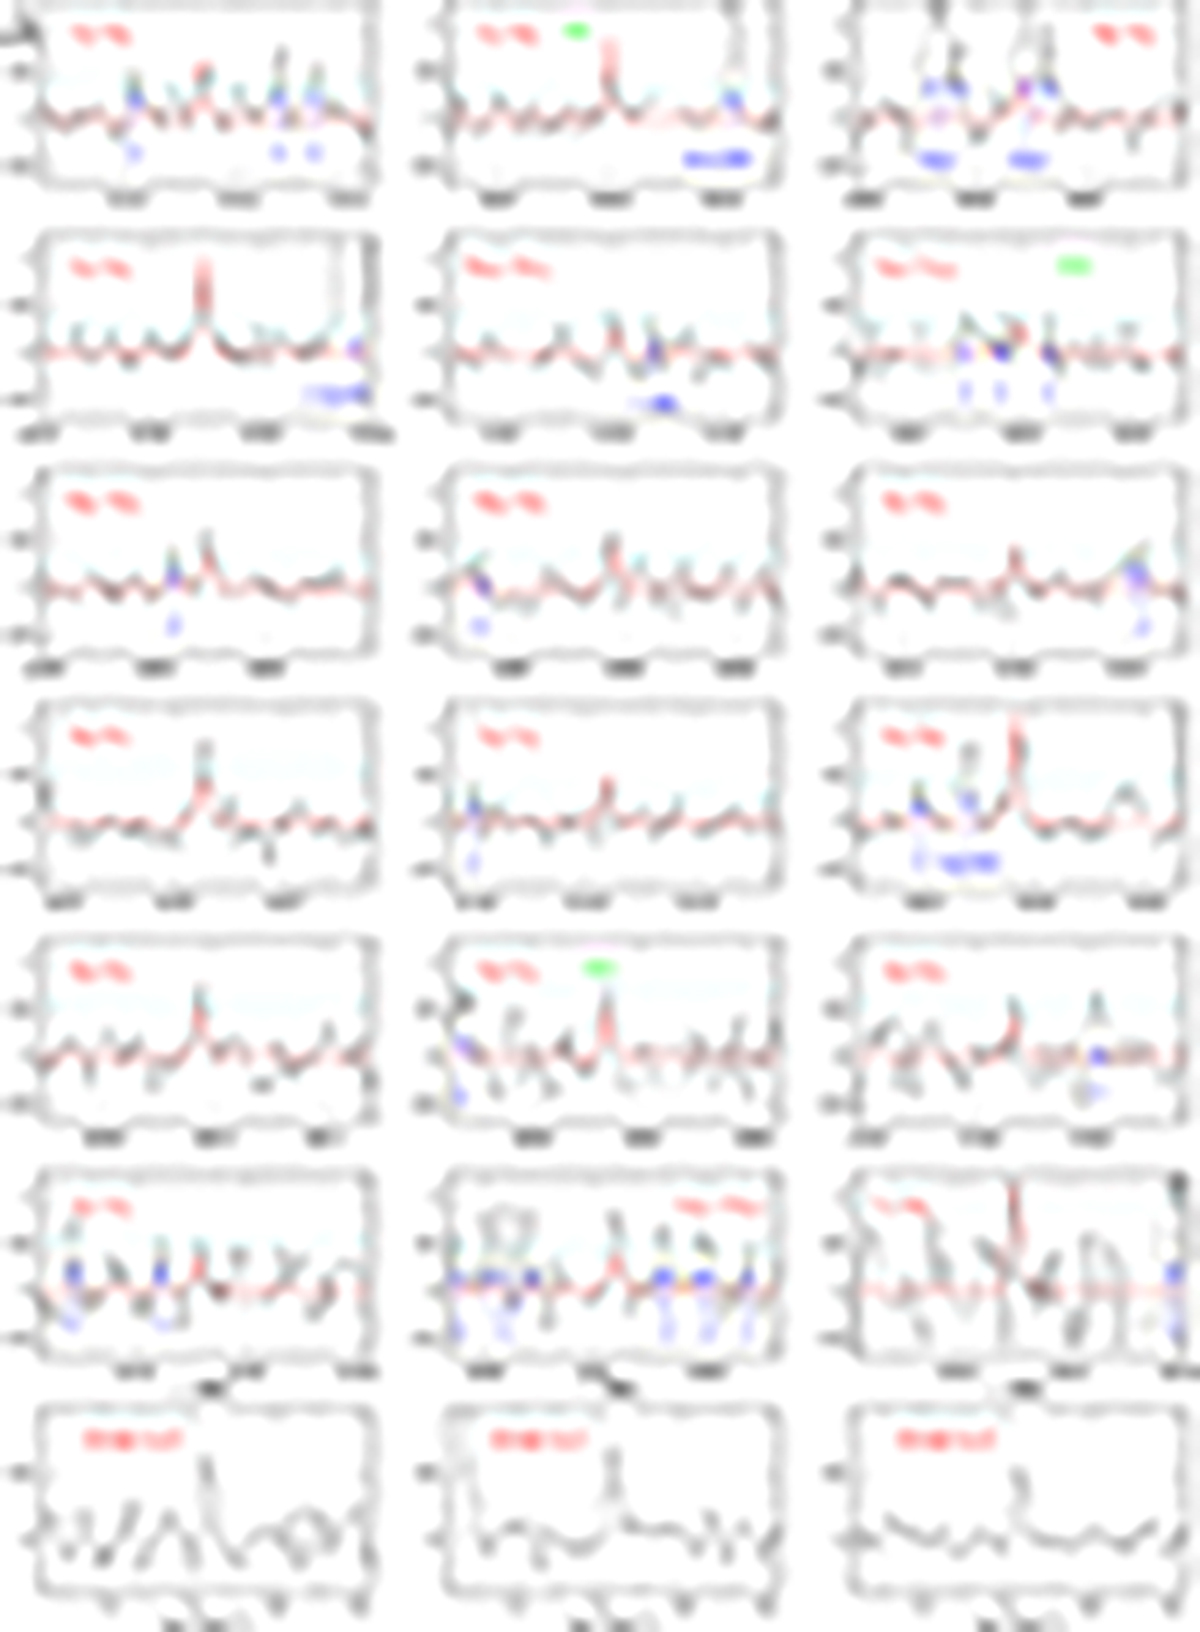
Selected transitions of HCCCH2CCH in TMC-1. The abscissa corresponds to the rest frequency of the lines. Frequencies and intensities for all observed lines are given in Table 1. The ordinate is the antenna temperature, corrected for atmospheric and telescope losses, in millikelvins. The quantum numbers of each transition are indicated in the corresponding panel. The red line shows the computed synthetic spectra for this species for Trot = 9.5 ± 0.5 K and a column density of (5.0 ± 0.5)×1012 cm−2 (see the main text). Blanked channels correspond to negative features produced when folding the frequency-switched data. Green labels indicate the transitions for which only one of the frequency-switching data points has been used (FS10 corresponds to a throw of 10 MHz). The three panels at the bottom show the average of all Ka = 0, 1, and 2 transitions. The noise level is below 0.1 mK for these stacked spectra. CH2CDCN is reported in the 616 − 505 transition panel. A detailed analysis of the isotopologues of CH2CHCN will be presented elsewhere (Cernicharo et al., in prep.).
Current usage metrics show cumulative count of Article Views (full-text article views including HTML views, PDF and ePub downloads, according to the available data) and Abstracts Views on Vision4Press platform.
Data correspond to usage on the plateform after 2015. The current usage metrics is available 48-96 hours after online publication and is updated daily on week days.
Initial download of the metrics may take a while.