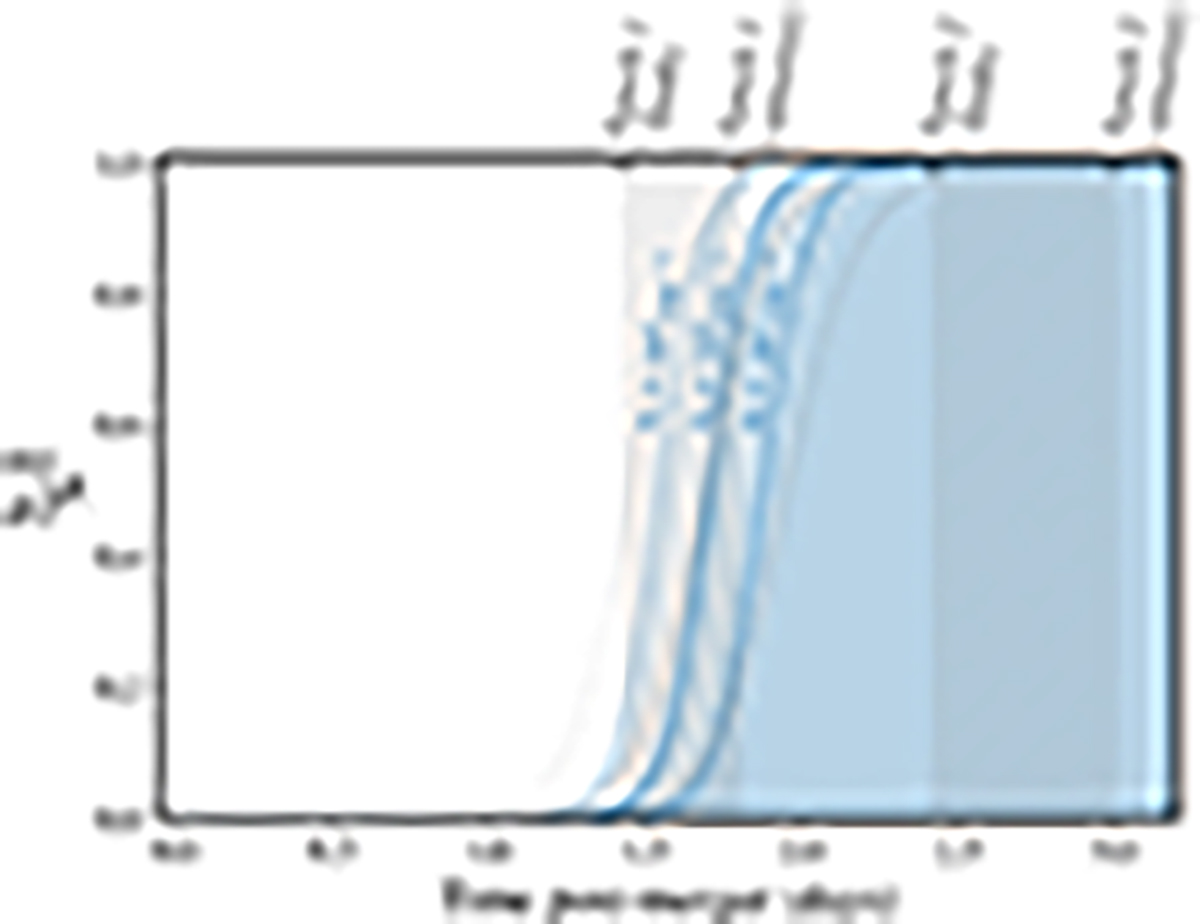
Fig. 4.
Download original image
Fraction of Sr in its first ionised state given the time since the merger in LTE. The Sr II is shown as a fraction of total Sr and is transitioning (recombining) from the Sr III state. The blue lines are based on the temperature evolution from the sub-epoch analysis in this paper, while the grey background lines assume the slower cooling in Waxman et al. (2018). Dashed and dotted lines show the fraction assuming different electron densities. Regardless of the exact cooling rate, and across a broad range of electron densities, there is a sharp transition from Sr III to Sr II at 1.4–1.7 days post-merger (or equivalently, for an observer, the absorption will form at 1.0–1.2 days). This suggests that (1) spectra taken just a few hours earlier would have a significantly different Sr II profile and (2) the more distant ejecta will have less Sr II. On the upper axis we show the time of X-shooter epochs 1–2 (Pian et al. 2017; Smartt et al. 2017). We note that, due to light-travel time delays, the more distant ejecta (near the limb) is observed at a different time than the anterior ejecta, as indicated with the grey shaded regions.
Current usage metrics show cumulative count of Article Views (full-text article views including HTML views, PDF and ePub downloads, according to the available data) and Abstracts Views on Vision4Press platform.
Data correspond to usage on the plateform after 2015. The current usage metrics is available 48-96 hours after online publication and is updated daily on week days.
Initial download of the metrics may take a while.