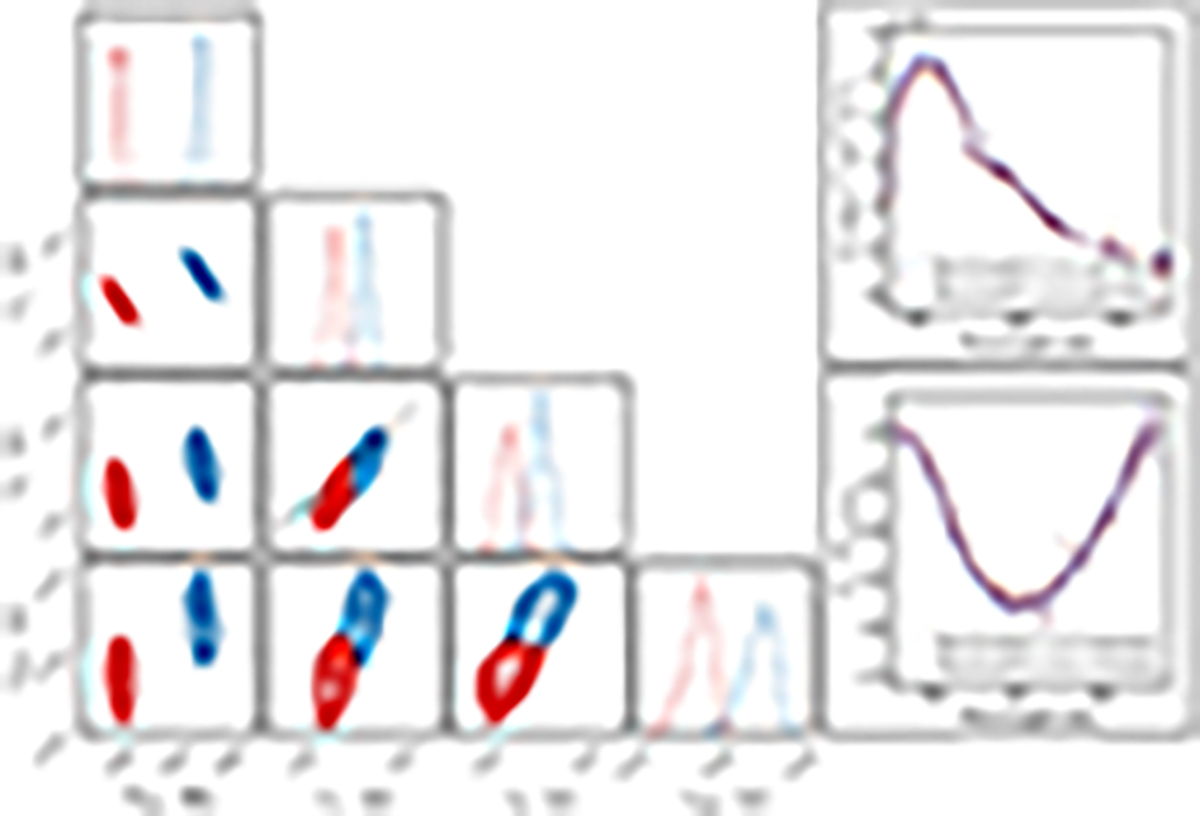
Fig. 2.
Download original image
Corner plot indicating the posterior probability distributions of key parameters determined by fitting the spectra in epoch 1.1+1.2 (blue) and epoch 1.3+1.4 (red). The fit parameters are (1) the best-fit observed blackbody temperature, Tobs, (2) the cross-sectional velocity, v⊥, derived from the blackbody normalisation, (3) the photospheric velocity of the 1 μm P Cygni feature, v∥, and (4) the outer ejecta velocity inferred from the 1 μm P Cygni feature, vmax. The dashed grey line in the v⊥ vs. v∥ plot indicates the line of equality, i.e., a spherically symmetric velocity surface. Computing the cross-sectional velocity requires an estimate of the distance to the host; here we assume DL = 44.2 ± 2.3 Mpc, as derived from the Planck cosmology (Planck Collaboration VI 2020), and the cosmological recession velocity of the host galaxy, zcosmic = 0.00986 ± 0.00049 (Mukherjee et al. 2021; Sneppen et al. 2023b). We did not propagate the 5% uncertainty in the absolute luminosity distance into v⊥, as we are interested in the relative change and uncertainties from fitting the spectra themselves. In the right panels, we illustrate the evolution in the continuum (top) and in the 1 μm absorption feature (bottom), which produces the subtle difference in the best-fit parameters. Additional systematic effects such as line-blending could shift the posteriors but are likely to affect sub-epochs in a similar fashion.
Current usage metrics show cumulative count of Article Views (full-text article views including HTML views, PDF and ePub downloads, according to the available data) and Abstracts Views on Vision4Press platform.
Data correspond to usage on the plateform after 2015. The current usage metrics is available 48-96 hours after online publication and is updated daily on week days.
Initial download of the metrics may take a while.