Fig. 1.
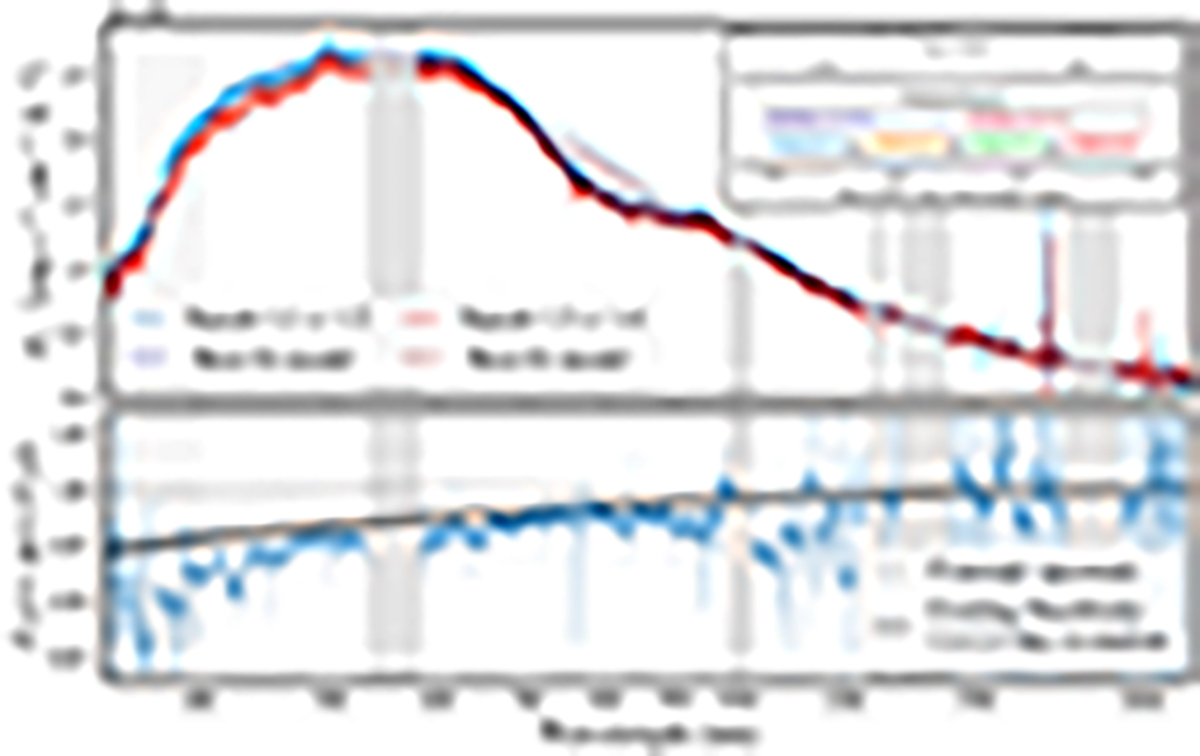
Download original image
AT2017gfo sub-epoch spectra from X-shooter at 1.43–1.46 days post-merger. Top panel: X-shooter spectra of the first (blue) and second (red) pair of exposures from epoch 1. The timeline of exposures is shown in the top-right inset. Corresponding best-fit models are shown with dashed lines. The spectral shapes are similar, but the later exposures are less luminous and have a lower blackbody temperature. Shaded bars indicate regions with strong tellurics and poorly constrained or noisy regions at the edge of the UVB, VIS, and NIR arms of the spectrograph. Lower panel: flux ratio as a function of wavelength (with the binned weighted mean overlaid), which shows a large fractional change in flux for the UV arm, a gradual evolution across the VIS arm, and a minor and somewhat noisy evolution in the NIR arm. The cooling blackbody prediction is taken from the epoch 1–2 evolution from Sneppen et al. (2023a). The data match the model reasonably well overall. However, the data seem to require a stronger temperature decline at this early time than the model prediction based on the overall epoch 1–2 evolution.
Current usage metrics show cumulative count of Article Views (full-text article views including HTML views, PDF and ePub downloads, according to the available data) and Abstracts Views on Vision4Press platform.
Data correspond to usage on the plateform after 2015. The current usage metrics is available 48-96 hours after online publication and is updated daily on week days.
Initial download of the metrics may take a while.