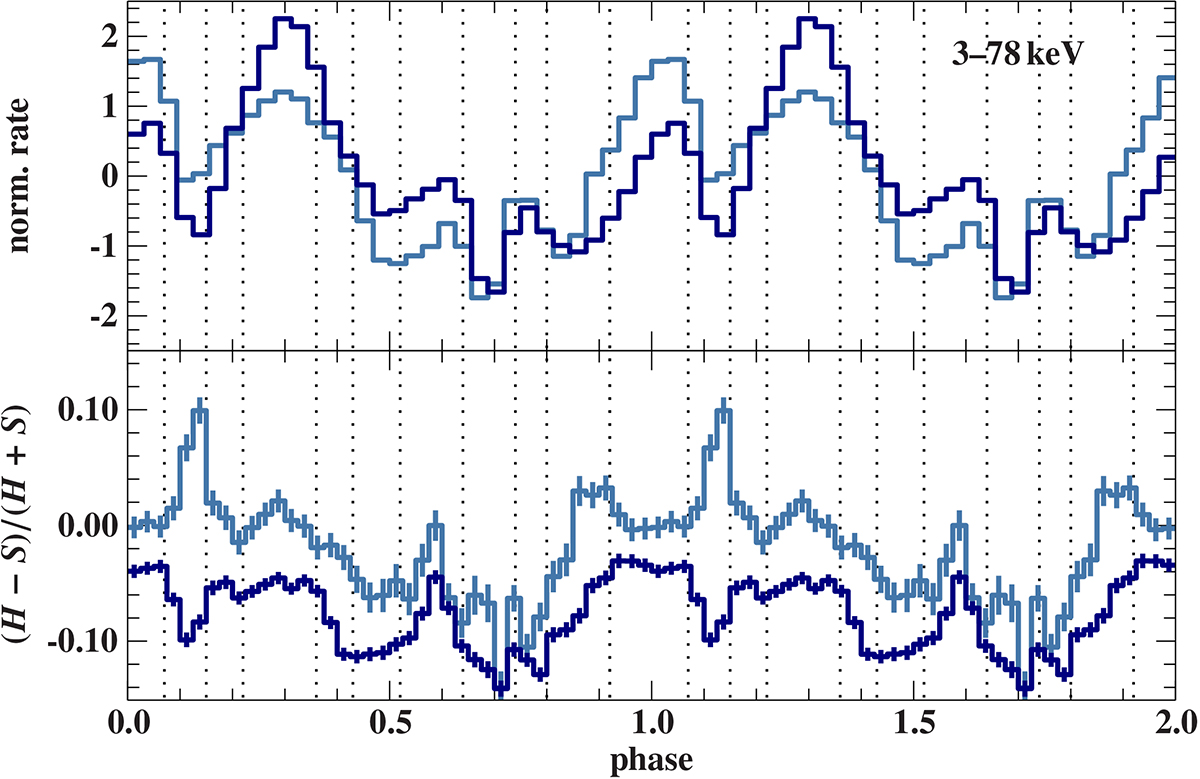
Fig. 5.
Download original image
Comparison of pulse profile and hardness ratio between Obs. I and II. Top: NuSTAR broadband pulse profile for Obs. I (dark blue) and Obs. II (light blue). The pulse profiles are normalized to average zero and units of standard deviation. Dotted lines mark the phase intervals selected for pulse-phase-resolved spectroscopy. Bottom: Hardness ratio of the 3–7 keV and 7–14 keV band, defined as (H − S)/(H + S). The phase definition is the same as in Paper I.
Current usage metrics show cumulative count of Article Views (full-text article views including HTML views, PDF and ePub downloads, according to the available data) and Abstracts Views on Vision4Press platform.
Data correspond to usage on the plateform after 2015. The current usage metrics is available 48-96 hours after online publication and is updated daily on week days.
Initial download of the metrics may take a while.