Fig. 4.
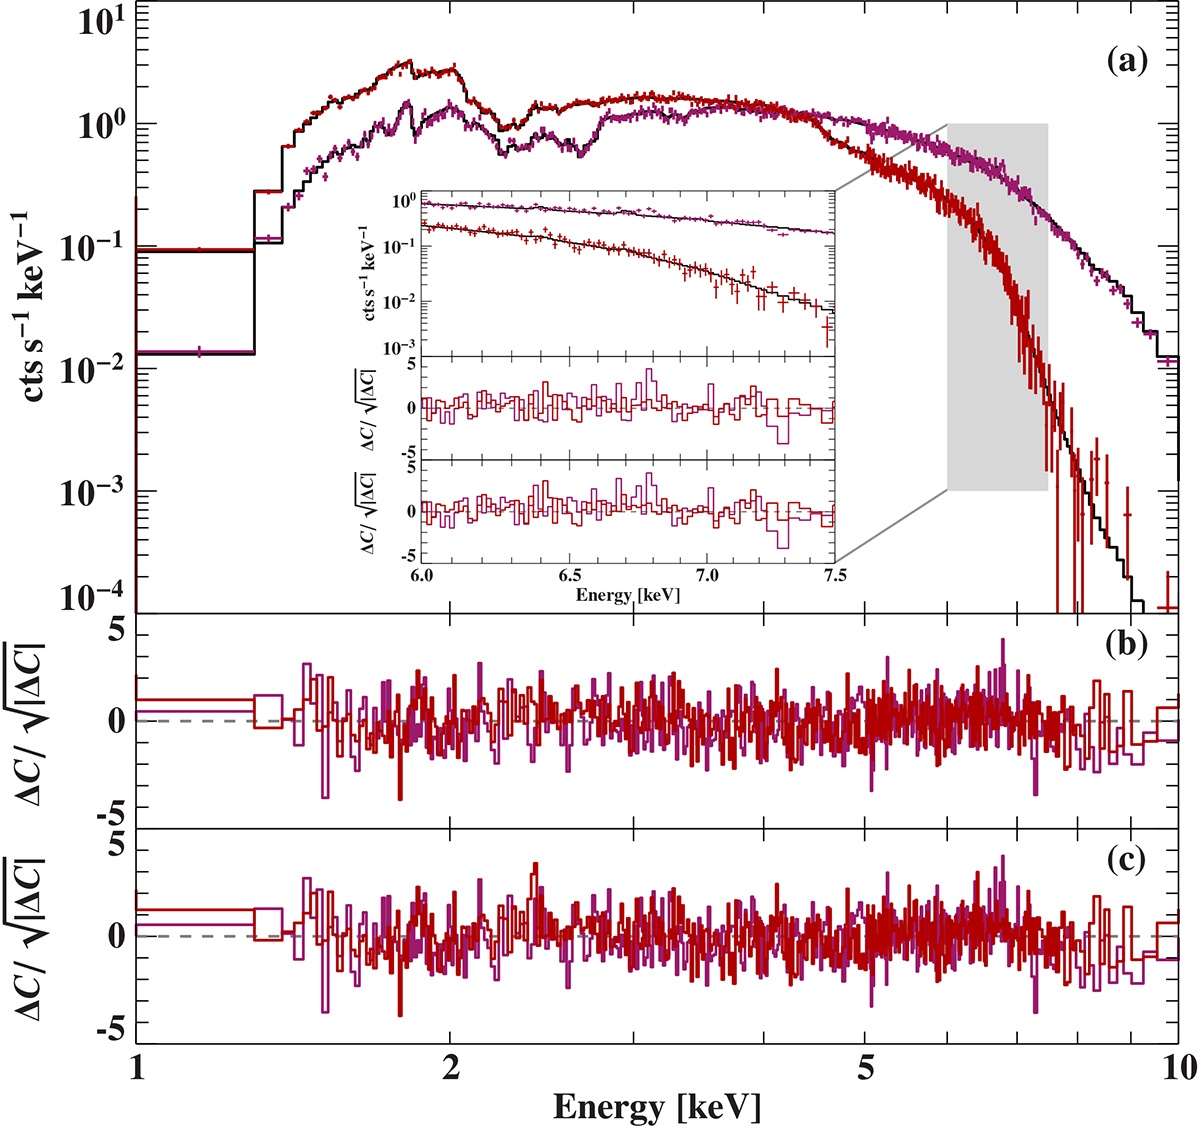
Download original image
Chandra/HETG spectrum of EXO 2030+375. Panel (a) shows the count spectrum of MEG (red) and HEG (magenta) with the best-fit model (black). The inset shows a close-up of the iron band. Panel (b) shows C residuals for the best-fit model with Si XIV Lyα, Fe Kα, Fe XXV Heα, and Fe XXVI Lyα lines. Panel (c) shows C residuals for the same best-fit continuum model without any emission lines.
Current usage metrics show cumulative count of Article Views (full-text article views including HTML views, PDF and ePub downloads, according to the available data) and Abstracts Views on Vision4Press platform.
Data correspond to usage on the plateform after 2015. The current usage metrics is available 48-96 hours after online publication and is updated daily on week days.
Initial download of the metrics may take a while.