Fig. 1.
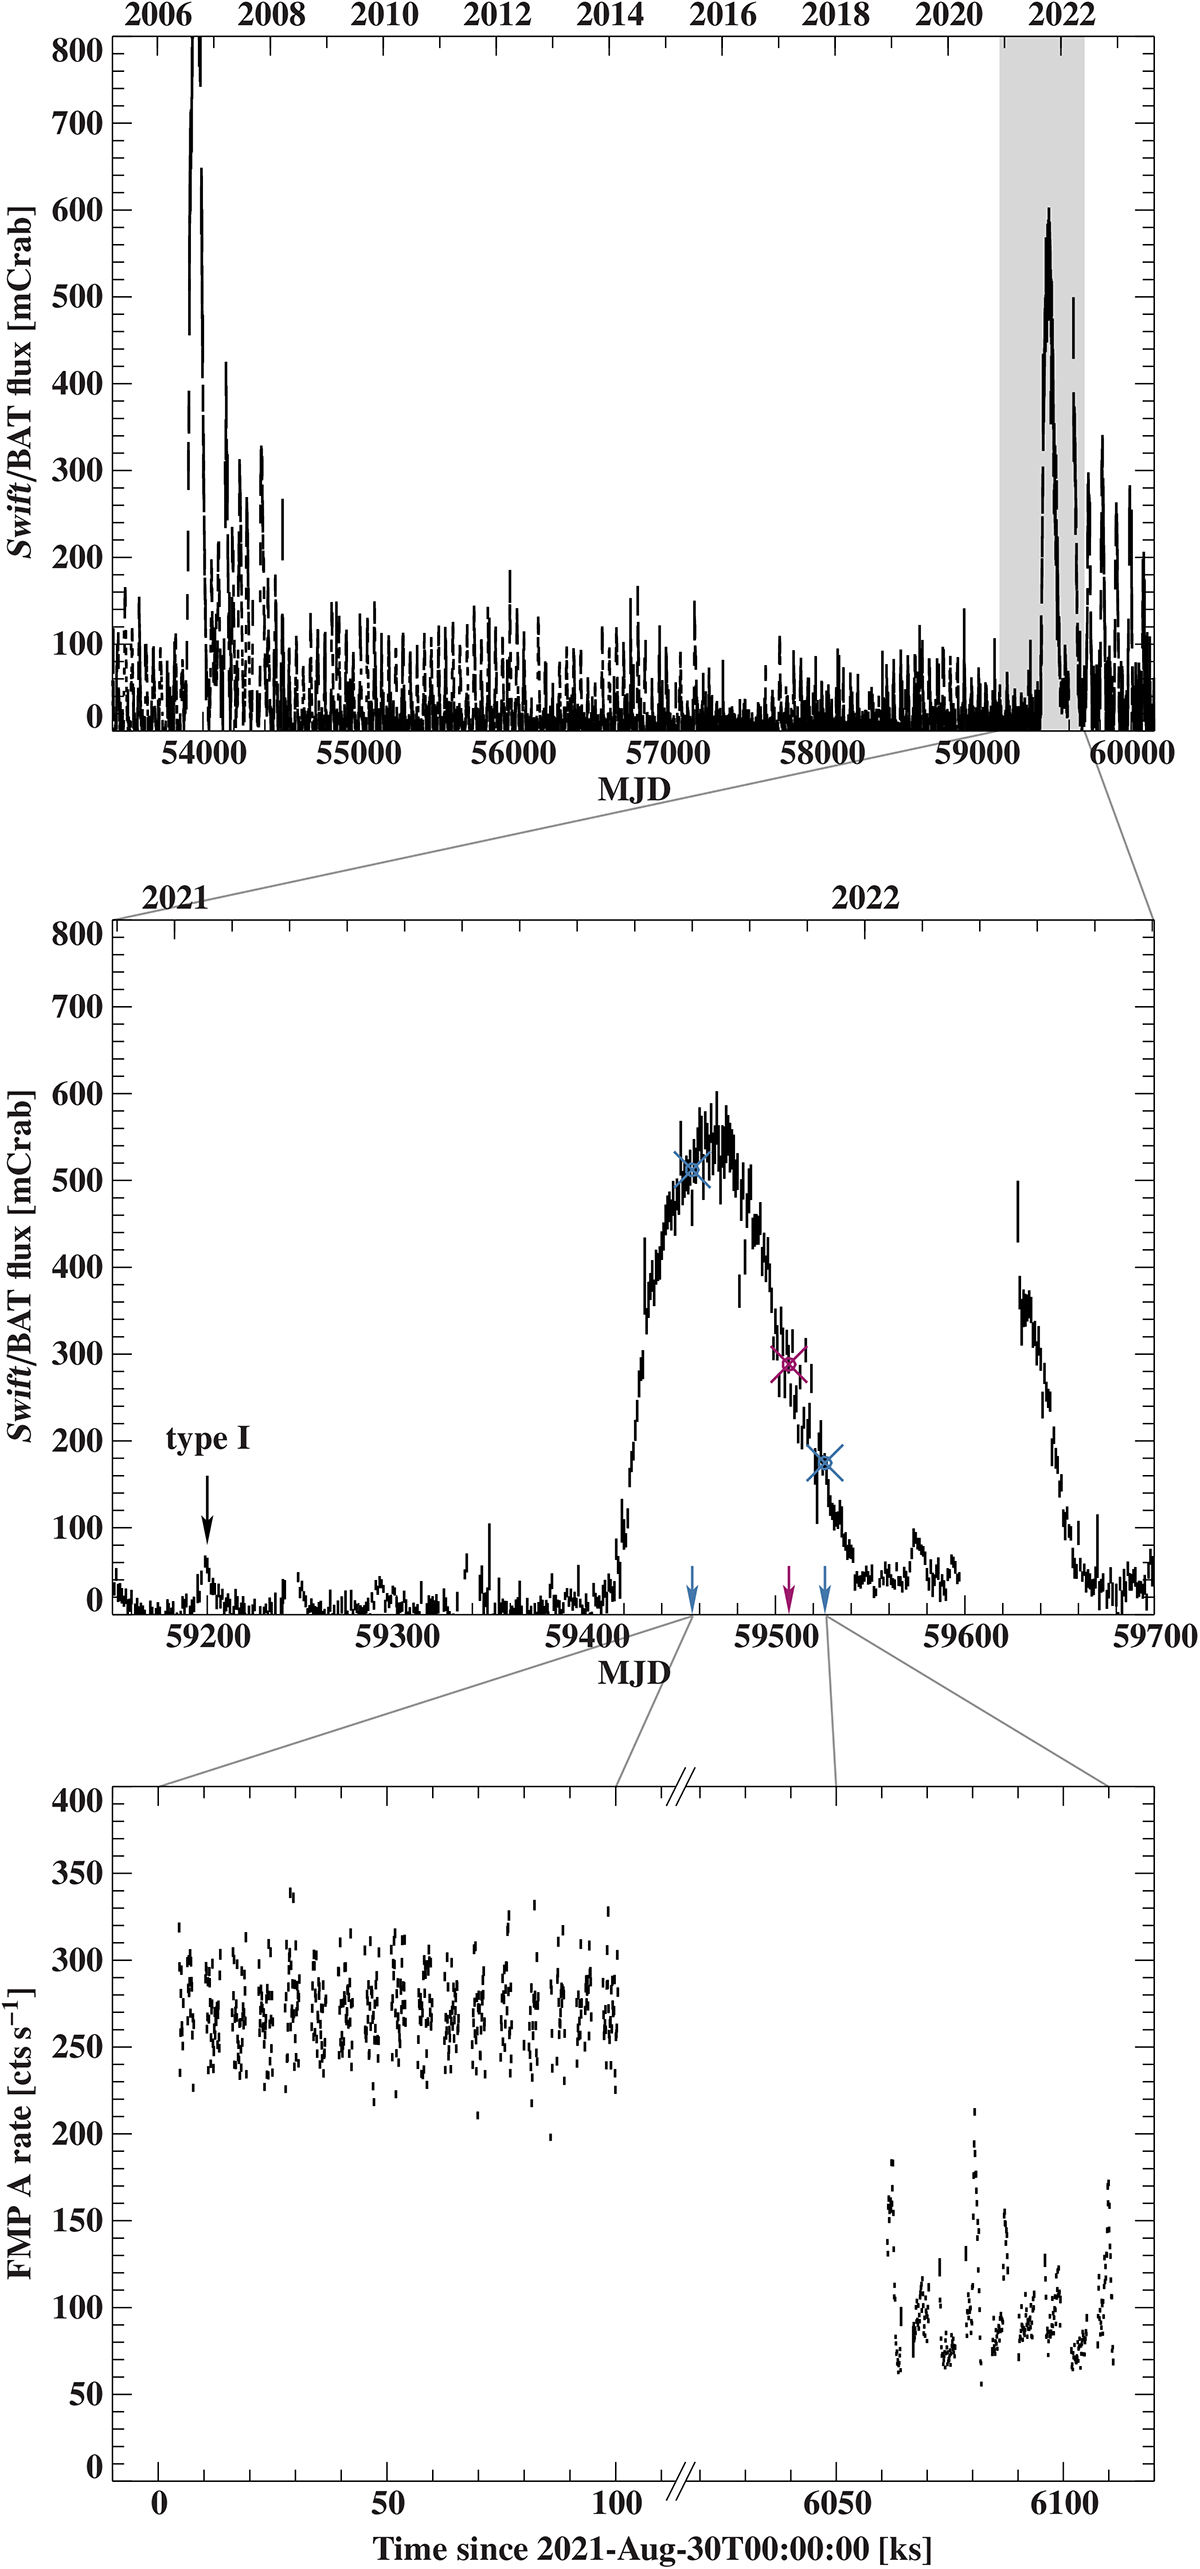
Download original image
Variability of EXO 2030+375 on different timescales. Top: Long-term Swift/BAT light curve of the giant 2022 outburst of EXO 2030+375 (Krimm et al. 2013). Middle: Close-up of the 2021 giant outburst. Blue crosses mark the times of the NuSTAR observations, and the magenta cross marks the time of the Chandra observation. Bottom: NuSTAR 3–78 keV light curve of Obs. I and II with 100 s time resolution.
Current usage metrics show cumulative count of Article Views (full-text article views including HTML views, PDF and ePub downloads, according to the available data) and Abstracts Views on Vision4Press platform.
Data correspond to usage on the plateform after 2015. The current usage metrics is available 48-96 hours after online publication and is updated daily on week days.
Initial download of the metrics may take a while.