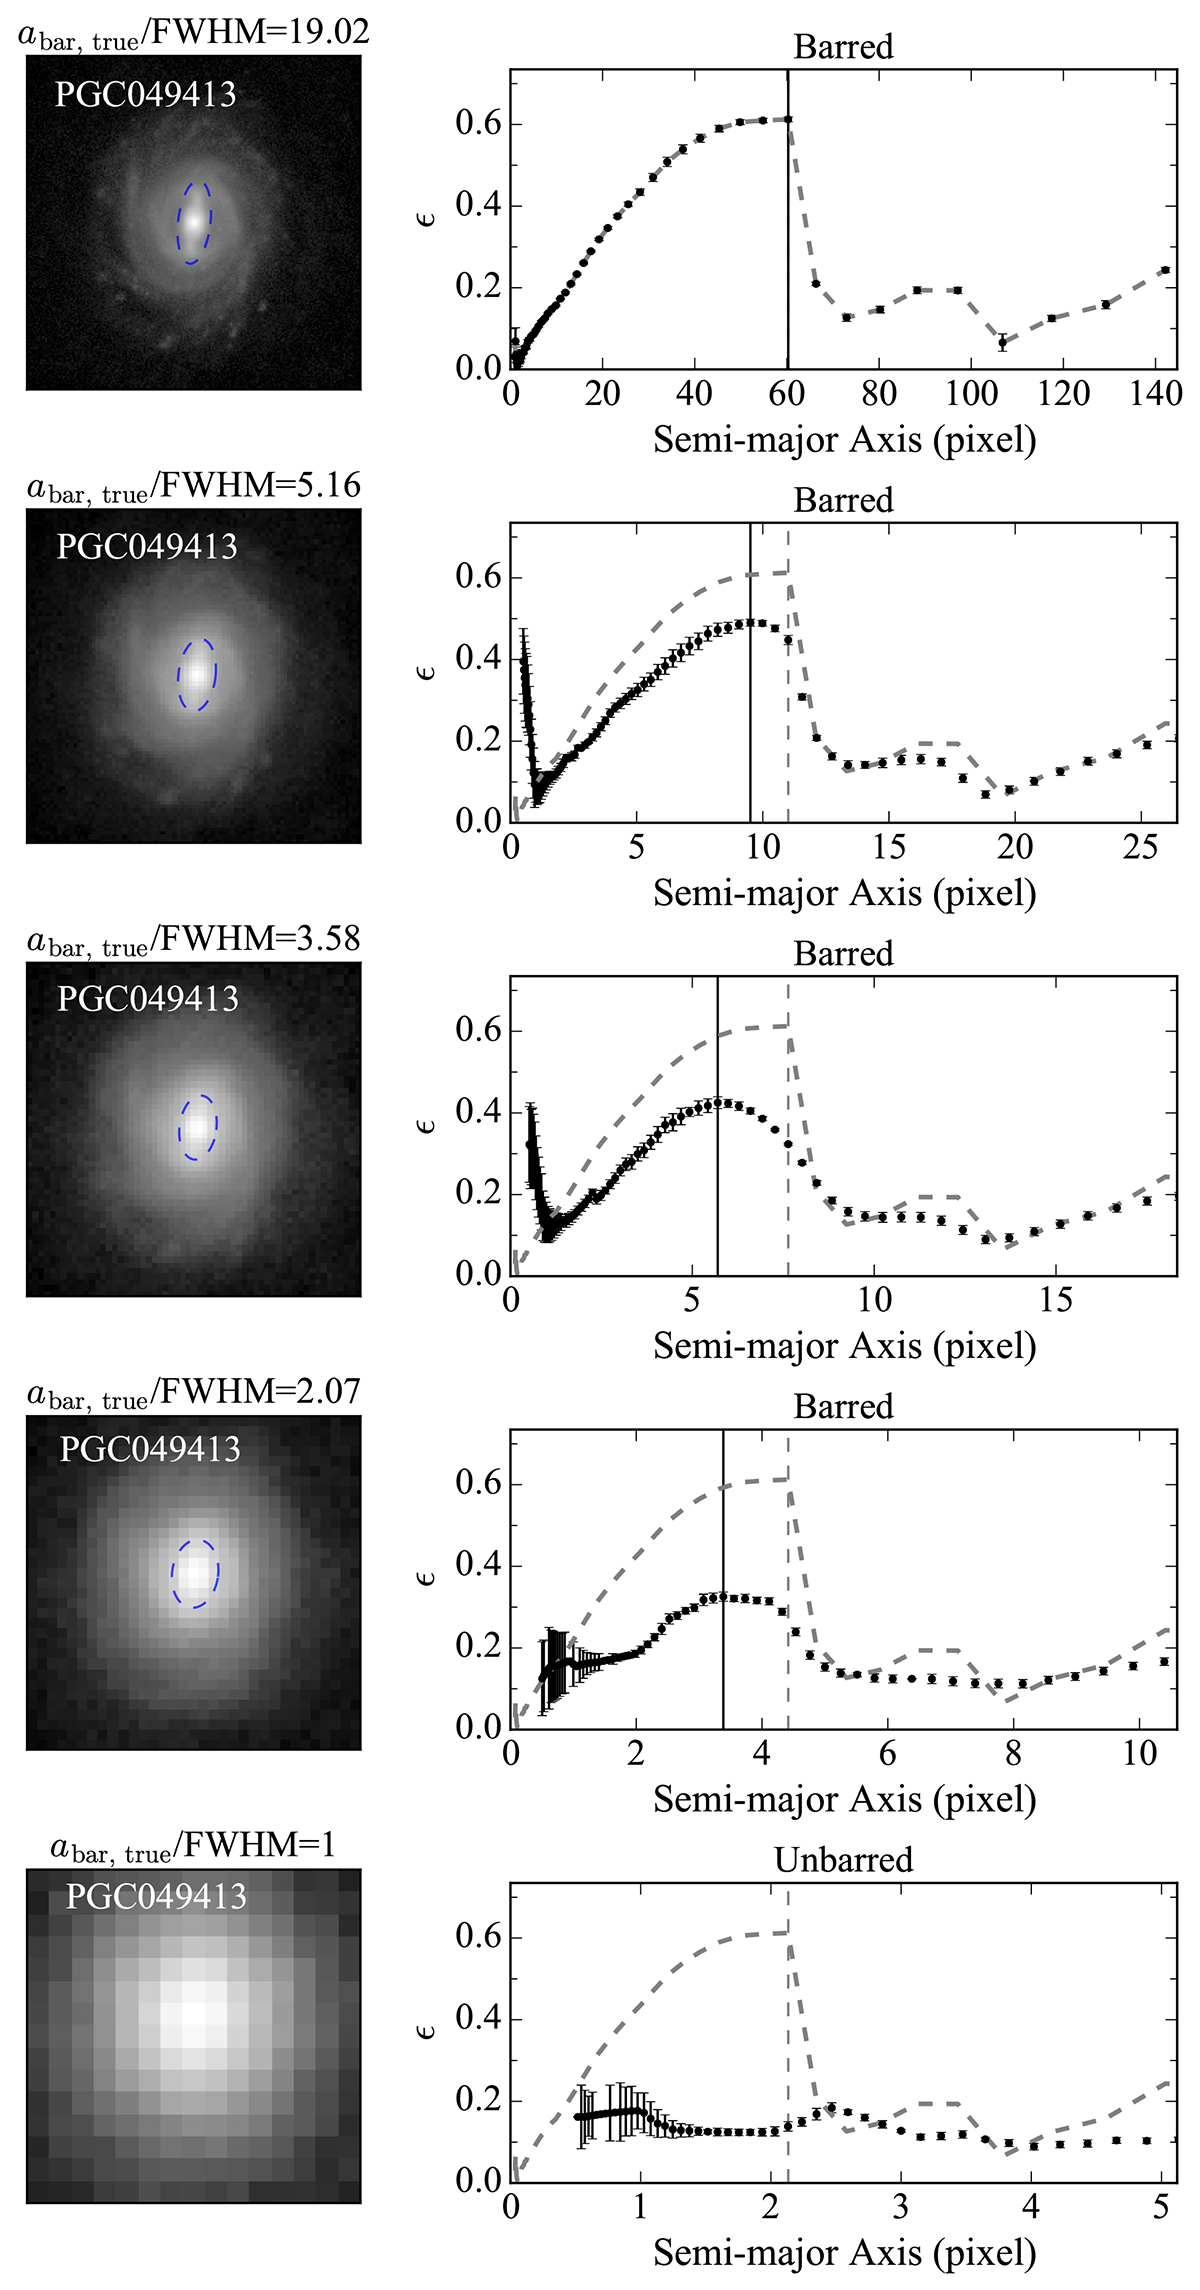
Fig. 2.
Download original image
Impact of the decreasing resolution on the bar analysis, using PGC049413 as an example. On the left are the galaxy images, and their respective derived ϵ profiles are shown at the right. At the top of each image, the ratio of abar, true to the FWHM is indicated. The first row shows the results from DESI, succeeded by the results from low-resolution F200W images in the rows below. The DESI ϵ profiles are plotted with dashed gray curves in the right panels. The intrinsic bar position is denoted as the vertical dashed gray line. When a bar is successfully identified, it is marked in the image by an ellipse and indicated in the profile by a vertical solid line.
Current usage metrics show cumulative count of Article Views (full-text article views including HTML views, PDF and ePub downloads, according to the available data) and Abstracts Views on Vision4Press platform.
Data correspond to usage on the plateform after 2015. The current usage metrics is available 48-96 hours after online publication and is updated daily on week days.
Initial download of the metrics may take a while.