Fig. 9
Download original image
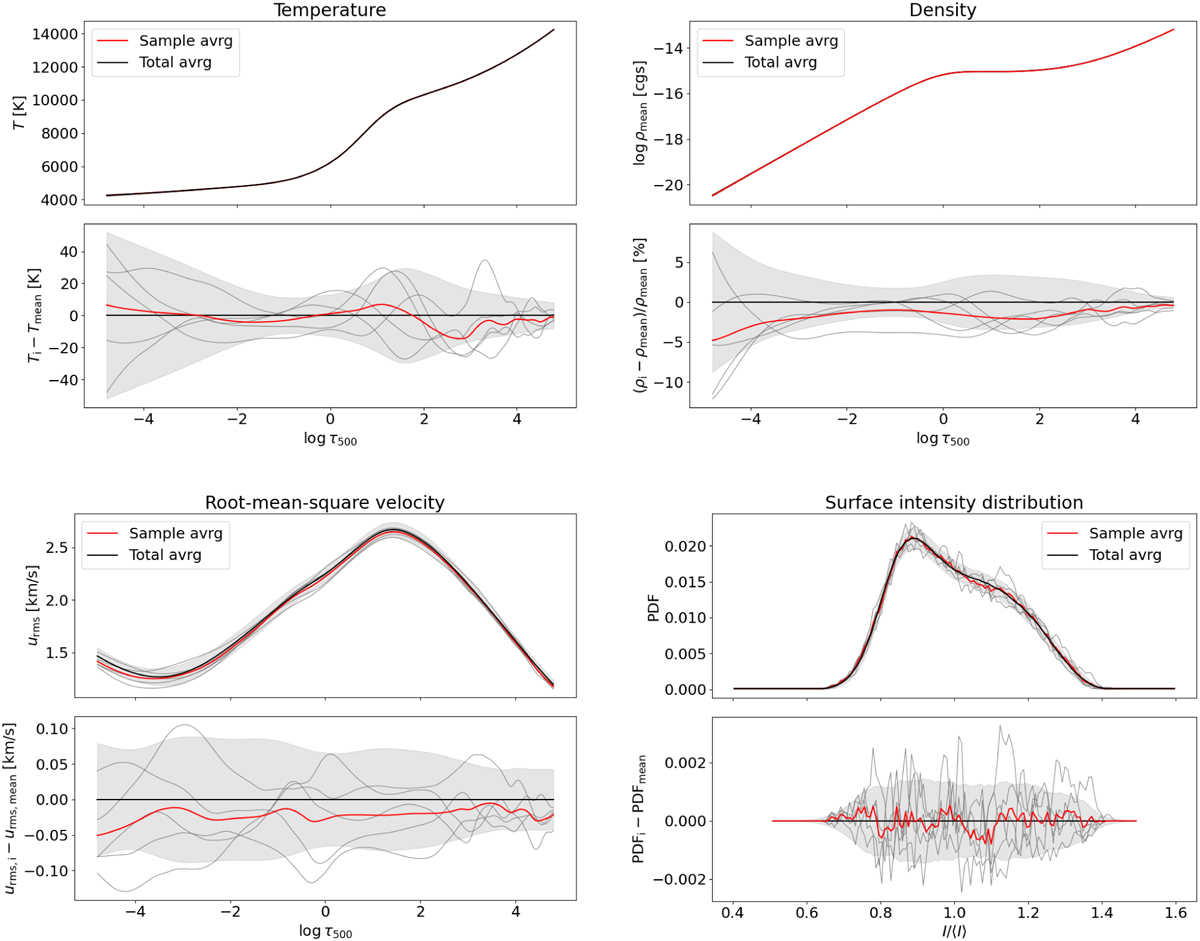
Overview of the subsample selection for the STAGGER model t5777g44m00 of size N = 5. Each panel shows the mean of the total time series (black line), its standard deviation (shaded grey area), the mean of the subsample (red line), and individual snapshots (grey lines), for the variables discussed in the text. From top to bottom and left to right, these are temperature, density, rms velocity, and the normalized probability distribution of surface intensity.
Current usage metrics show cumulative count of Article Views (full-text article views including HTML views, PDF and ePub downloads, according to the available data) and Abstracts Views on Vision4Press platform.
Data correspond to usage on the plateform after 2015. The current usage metrics is available 48-96 hours after online publication and is updated daily on week days.
Initial download of the metrics may take a while.