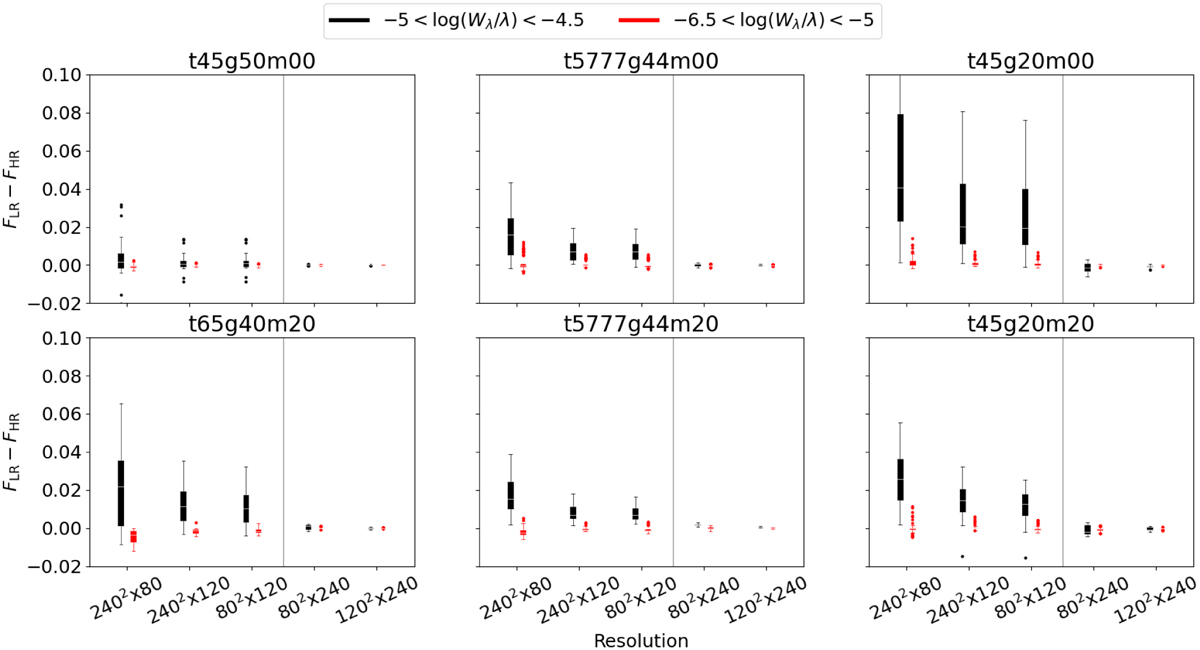
Fig. 7
Download original image
Overview of the maximum difference in normalised flux, over the complete line profile, for five different spatial resolutions compared to the reference 2402 × 240 resolution. Each box plot contains information from all lines that satisfy the reduced equivalent width requirement shown in the legend. The median of the box plot is represented by a horizontal white line and outliers with a black or red dot. The vertical grey line divides the models with reduced vertical and horizontal resolution.
Current usage metrics show cumulative count of Article Views (full-text article views including HTML views, PDF and ePub downloads, according to the available data) and Abstracts Views on Vision4Press platform.
Data correspond to usage on the plateform after 2015. The current usage metrics is available 48-96 hours after online publication and is updated daily on week days.
Initial download of the metrics may take a while.