Fig. 4
Download original image
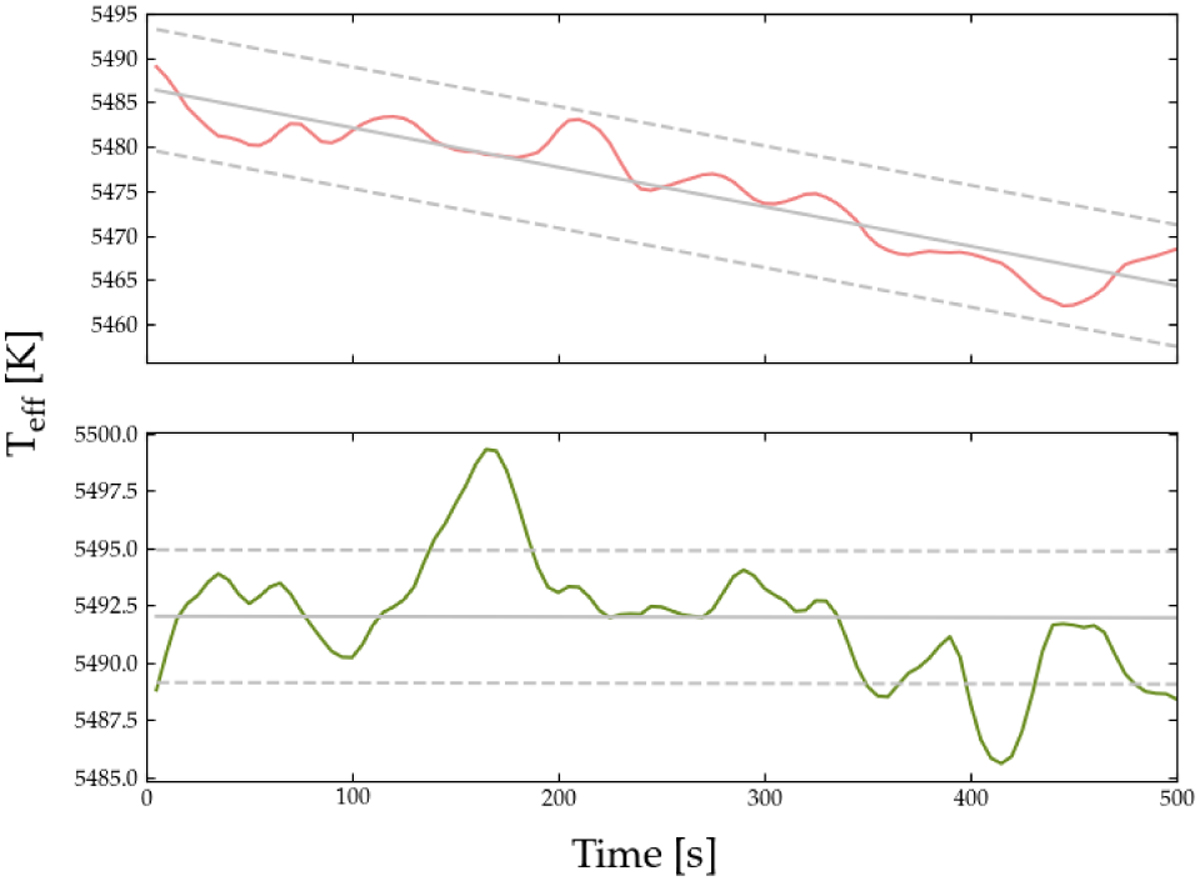
Time evolution of Teff for the same model with Teff = 5500 K, log 𝑔 = 5.0, and [Fe/H] = −4.0. The top panel shows the original non-relaxed model from the grid, with Teff decreasing quite quickly, while the new relaxed model is shown in the bottom panel. The solid grey lines indicate the mean Teff at a given time step, while the dashed lines are spaced out by 1–σ (standard deviation).
Current usage metrics show cumulative count of Article Views (full-text article views including HTML views, PDF and ePub downloads, according to the available data) and Abstracts Views on Vision4Press platform.
Data correspond to usage on the plateform after 2015. The current usage metrics is available 48-96 hours after online publication and is updated daily on week days.
Initial download of the metrics may take a while.