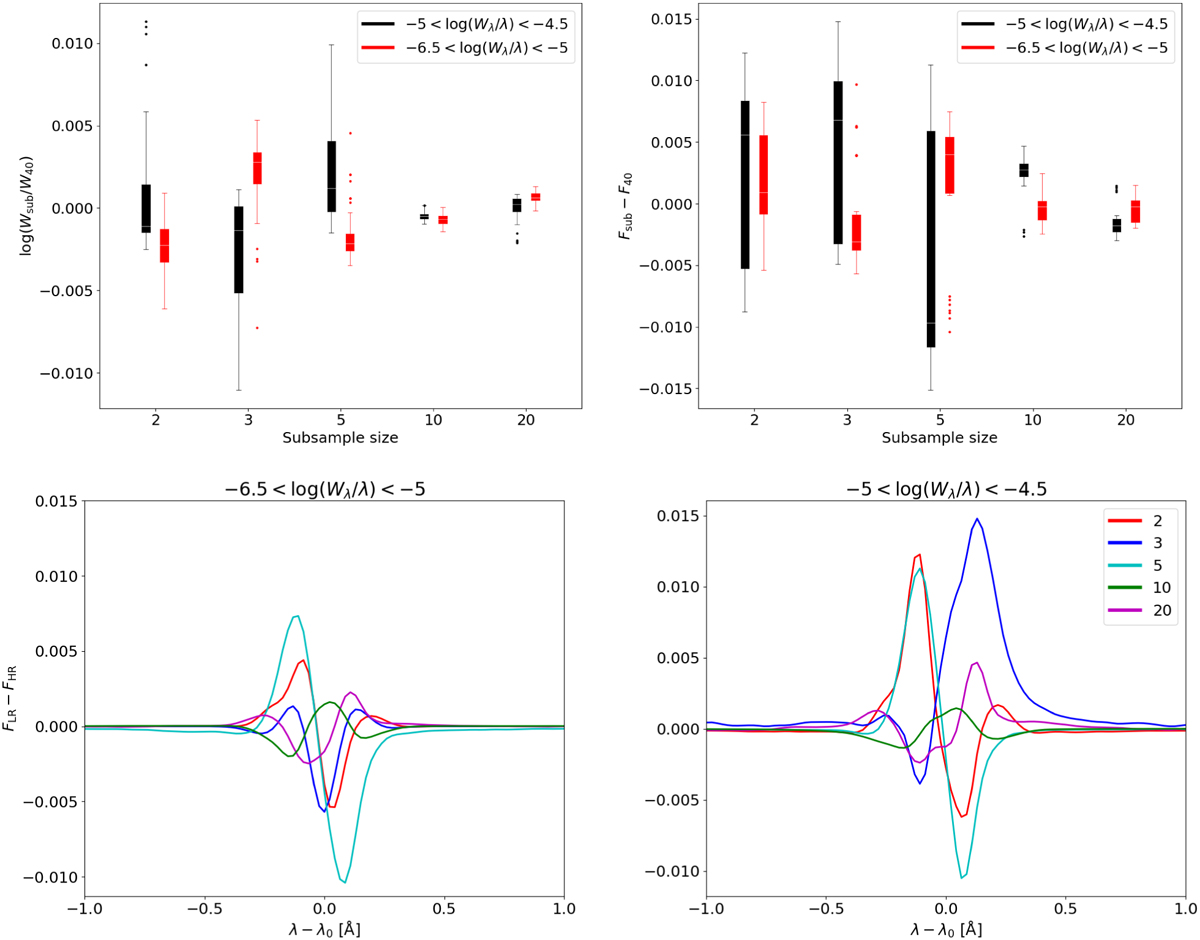
Fig. 10
Download original image
Overview of the relative difference in reduced equivalent width and (maximum) difference in normalised flux for five subsamples compared to the reference sample (N = 40). Each box plot contains information from all lines that satisfy the reduced equivalent width requirement shown in the legend. The bottom two panels show the relative difference in normalised line flux profile between the subsamples and the reference sample for two weak and two saturated fictitious Fe I lines with the largest and smallest maximum flux difference, respectively.
Current usage metrics show cumulative count of Article Views (full-text article views including HTML views, PDF and ePub downloads, according to the available data) and Abstracts Views on Vision4Press platform.
Data correspond to usage on the plateform after 2015. The current usage metrics is available 48-96 hours after online publication and is updated daily on week days.
Initial download of the metrics may take a while.