Fig. 6
Download original image
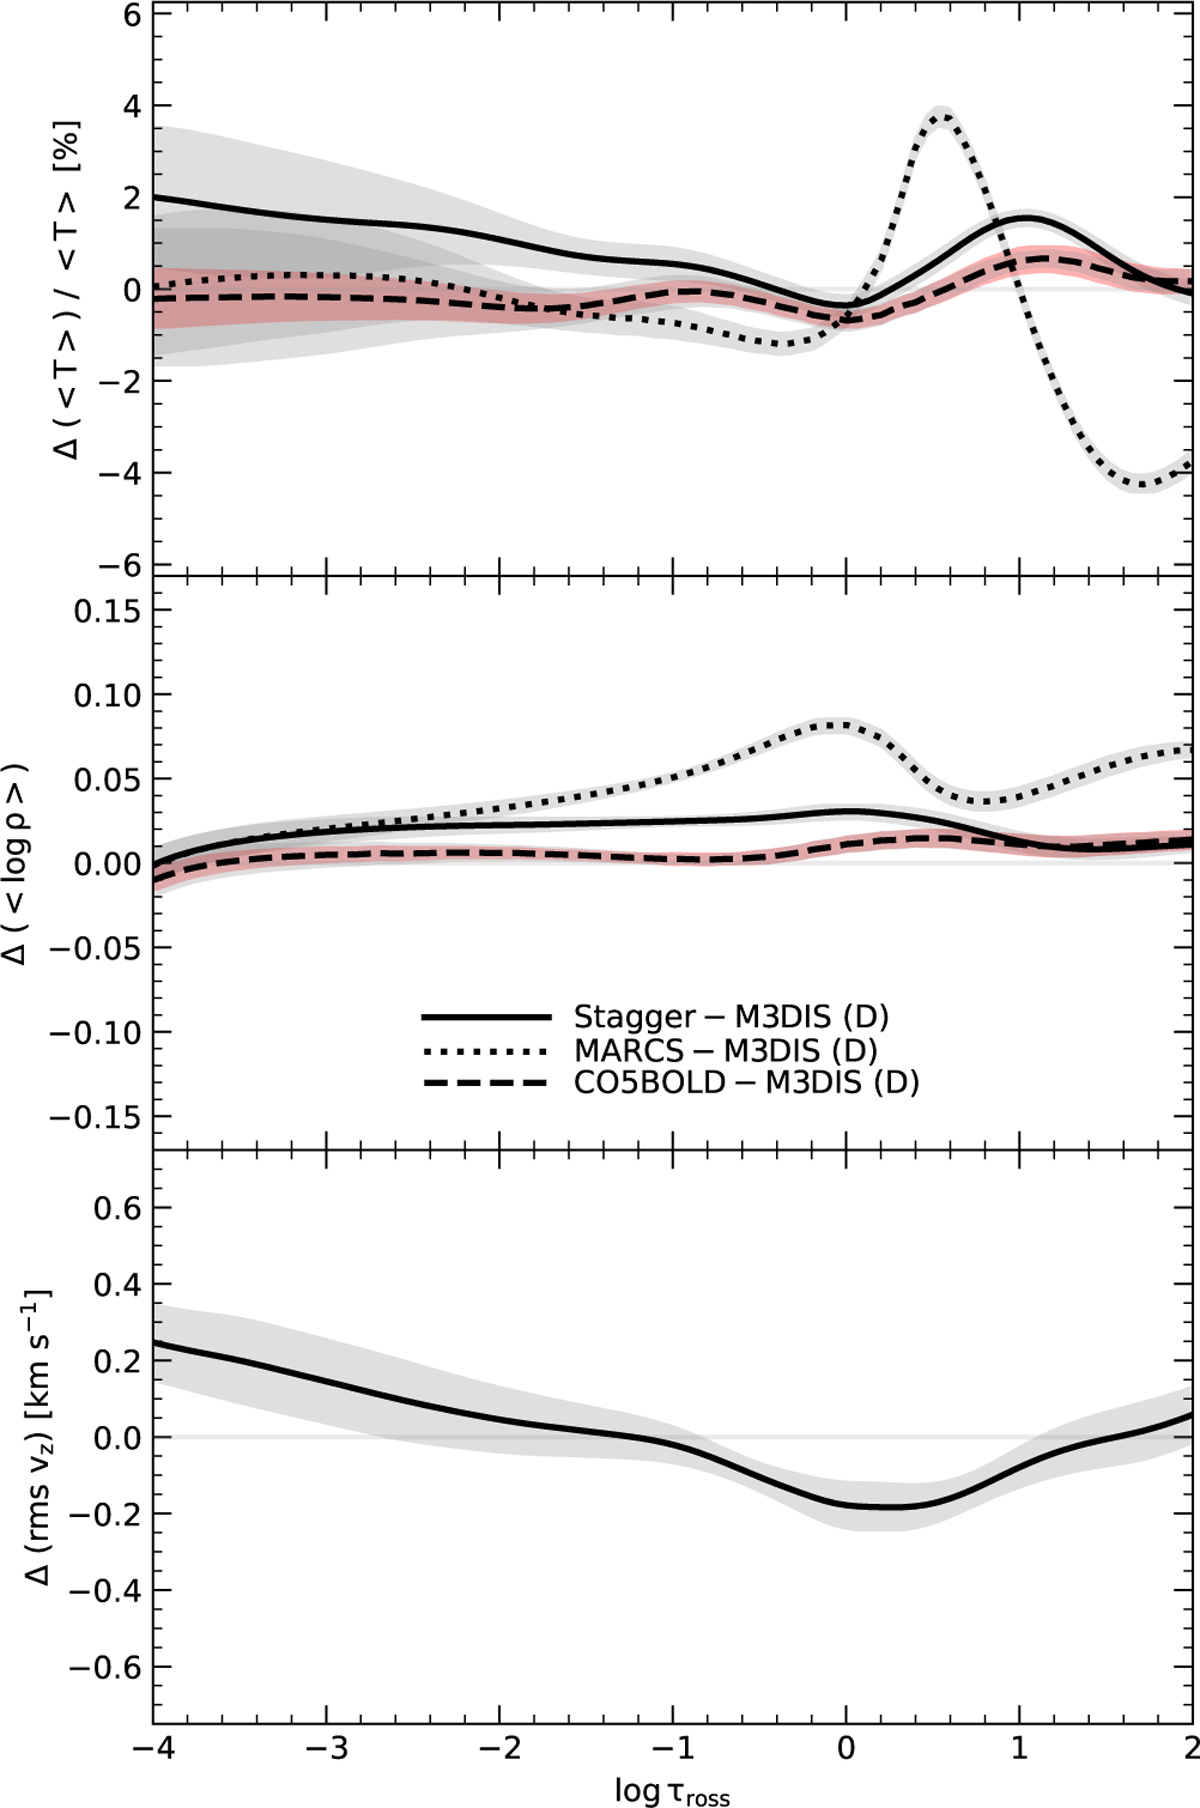
Differences in average 3D temperature (top), density (middle) and rms vertical velocity (bottom) structure as a function of Rosseland optical depth for our best solar model (M3DIS), STAGGER, CO5BOLD and MARCS. We include the MARCS models, because they are among the most widely-used 1D hydrostatic model atmospheres for FGKM type stars analyses. The average M3DIS structure and the grey shading correspond to mean and standard deviation between 9 different snapshots of the high resolution model, respectively. For CO5 BOLD, the mean of 20 different snapshots was used. We also include the standard deviation between these snapshots in red as a reference.
Current usage metrics show cumulative count of Article Views (full-text article views including HTML views, PDF and ePub downloads, according to the available data) and Abstracts Views on Vision4Press platform.
Data correspond to usage on the plateform after 2015. The current usage metrics is available 48-96 hours after online publication and is updated daily on week days.
Initial download of the metrics may take a while.