Fig. 5
Download original image
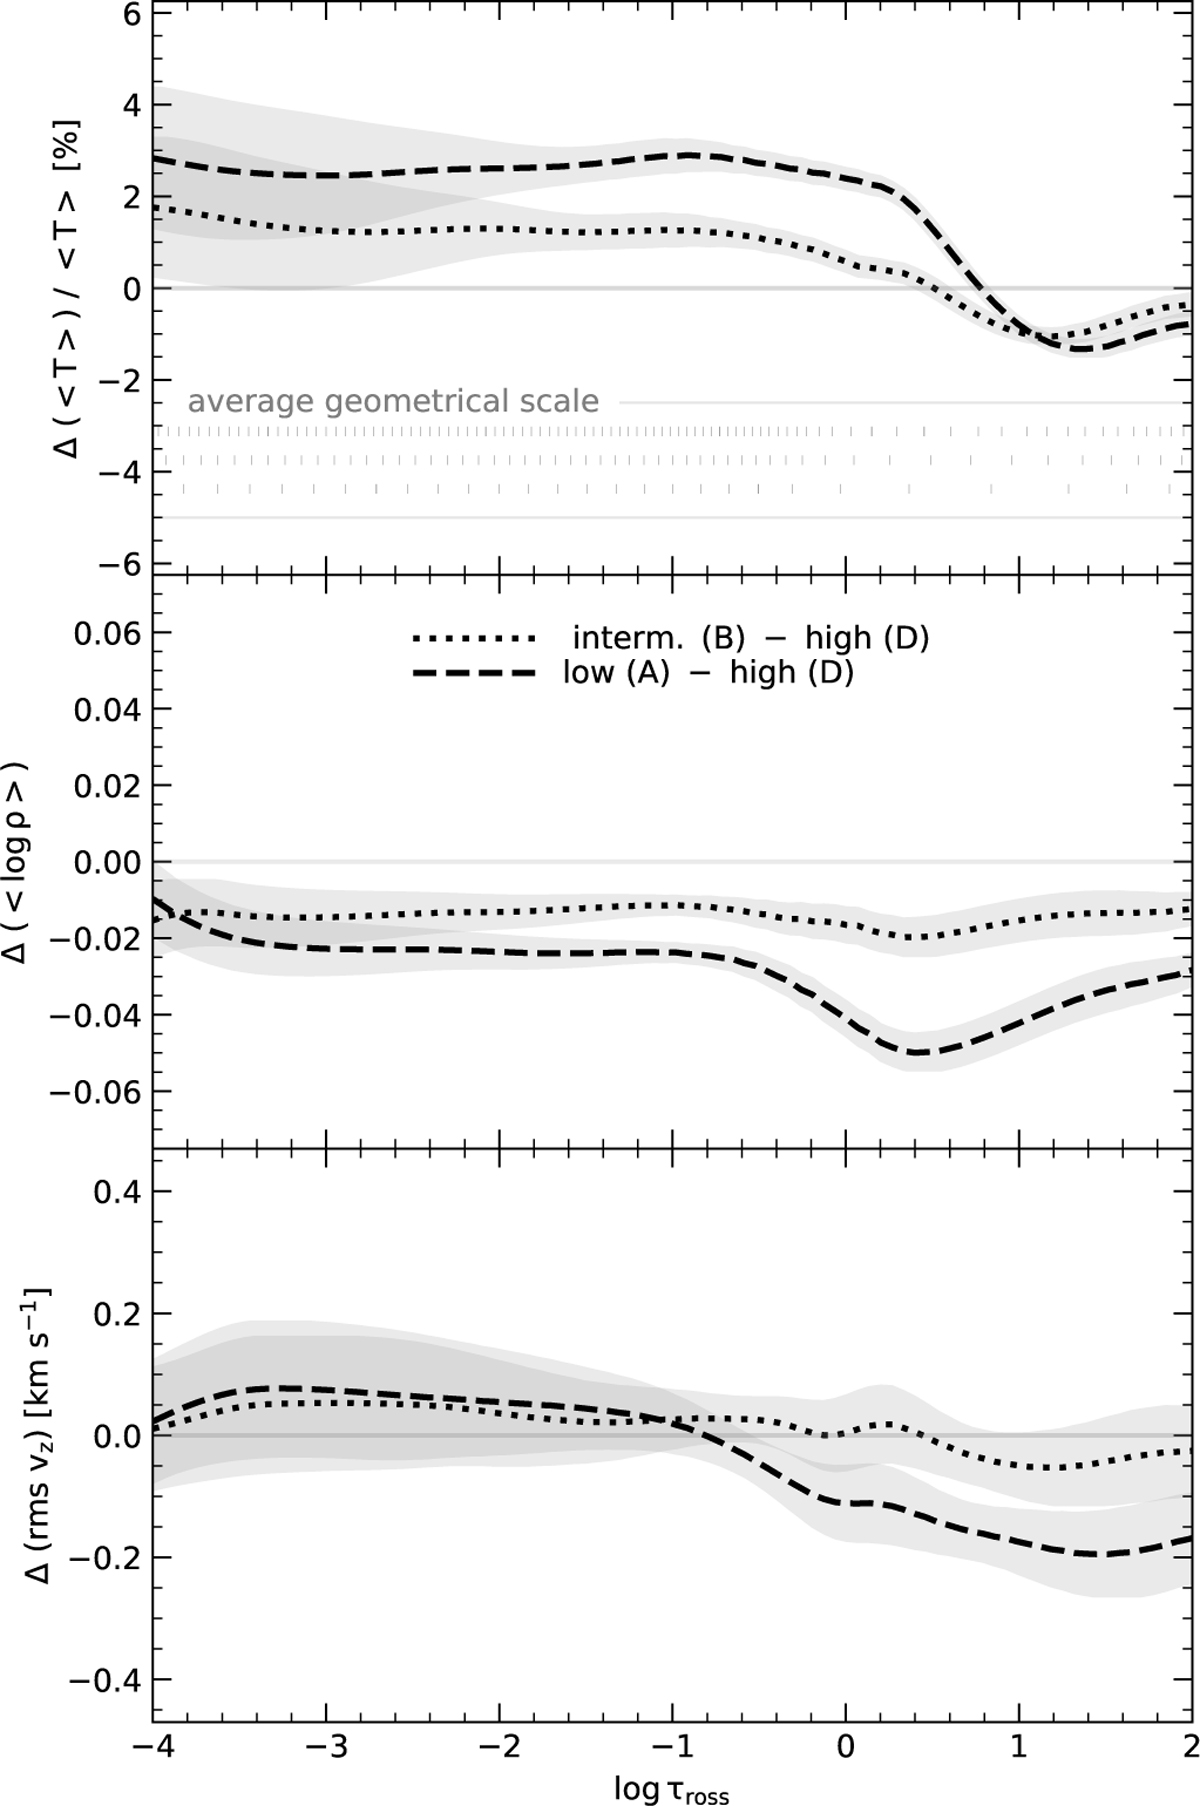
Average temperature (top) and density (middle) profiles, as well as rms vertical velocity (bottom) for models of different resolution. In each panel the difference to the highest resolution model (Δz = 7.7 km) is shown. Shading corresponds to the standard deviation between 9 different snapshots of the high resolution model. In the top panel we include the average geometrical depth scale of models A, B and D (from bottom to top) as vertical grey bars.
Current usage metrics show cumulative count of Article Views (full-text article views including HTML views, PDF and ePub downloads, according to the available data) and Abstracts Views on Vision4Press platform.
Data correspond to usage on the plateform after 2015. The current usage metrics is available 48-96 hours after online publication and is updated daily on week days.
Initial download of the metrics may take a while.