Fig. 13
Download original image
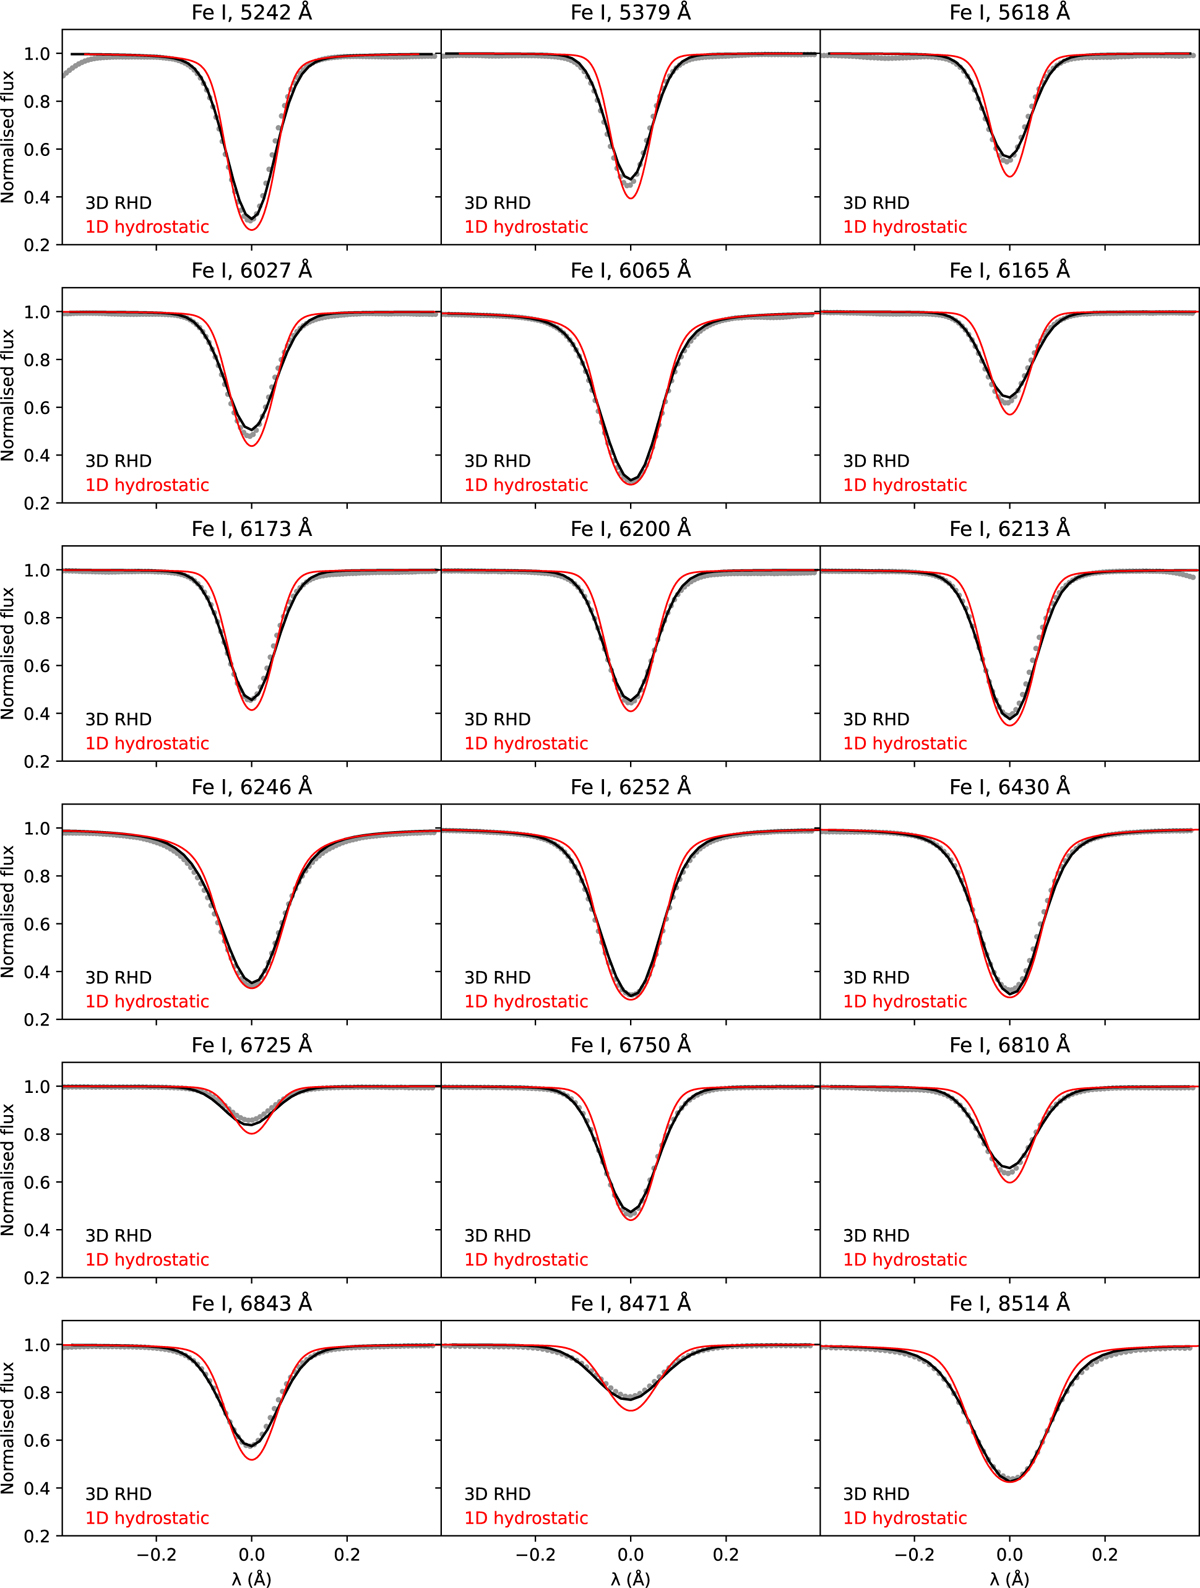
Comparison of the observed solar Fe I lines from the FTS KPNO flux atlas (Kurucz et al. 1984) with the synthetic line profiles computed using our 3D RHD Dispatch model (3D RHD) and the MARCS solar model (1D hydrostatic). For both models, the same iron abundance of A(Fe) = 7.50 was used. To compute the MARCS line profiles, we additionally include a microturbulence of 1 km s−1. Except the solar rotation, no other broadening was applied and the synthetic lines were not fit to the observations in any way.
Current usage metrics show cumulative count of Article Views (full-text article views including HTML views, PDF and ePub downloads, according to the available data) and Abstracts Views on Vision4Press platform.
Data correspond to usage on the plateform after 2015. The current usage metrics is available 48-96 hours after online publication and is updated daily on week days.
Initial download of the metrics may take a while.