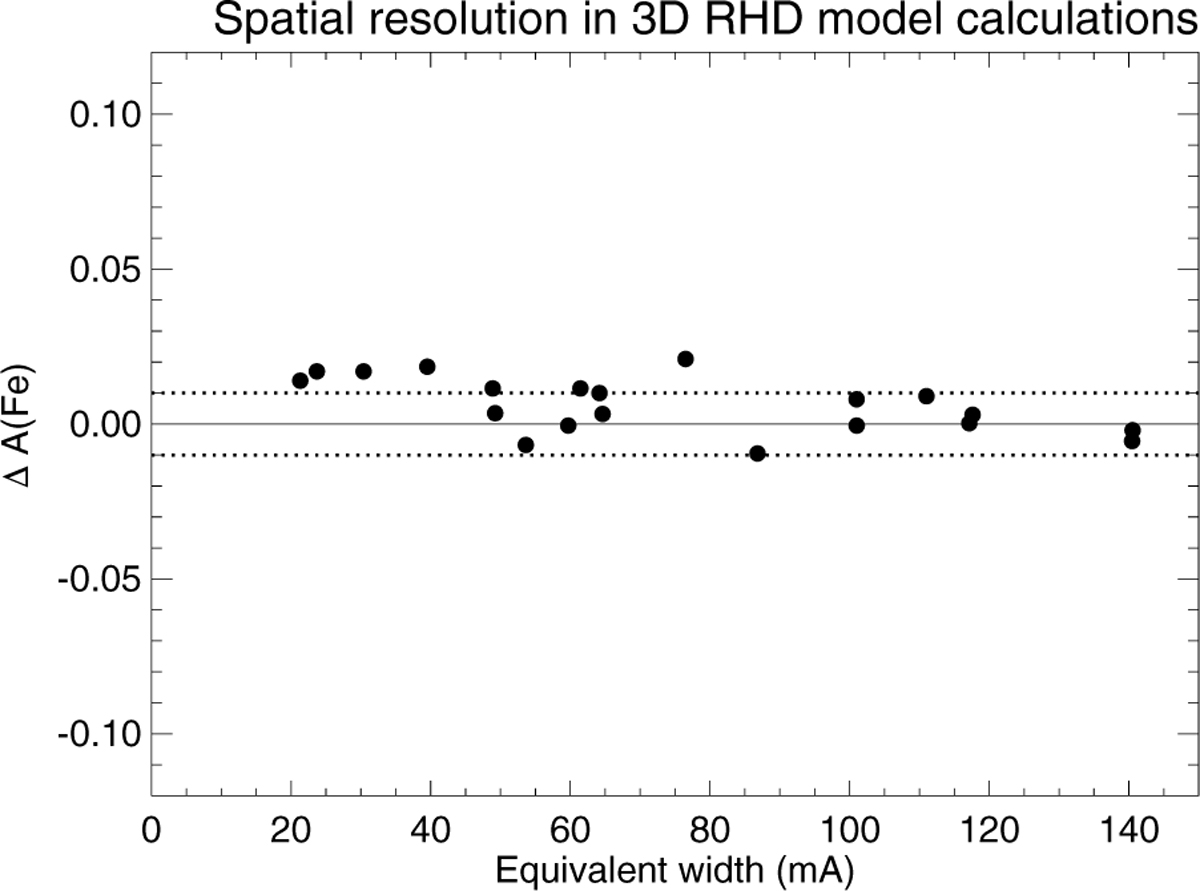
Fig. 12
Download original image
Error incurred in the Fe abundance as a function of equivalent line width corresponding to the difference between the high and very-high resolution models D and C, respectively. The horizontal lines show the 0.01 dex mark, to guide the eye. The ranges of y-axes are chosen deliberately to illustrate the typical error in abundances caused by the error of atomic data that, for diagnostic solar lines, ranges from 0.03 to 0.1 dex (Magg et al. 2022).
Current usage metrics show cumulative count of Article Views (full-text article views including HTML views, PDF and ePub downloads, according to the available data) and Abstracts Views on Vision4Press platform.
Data correspond to usage on the plateform after 2015. The current usage metrics is available 48-96 hours after online publication and is updated daily on week days.
Initial download of the metrics may take a while.