Fig. 11
Download original image
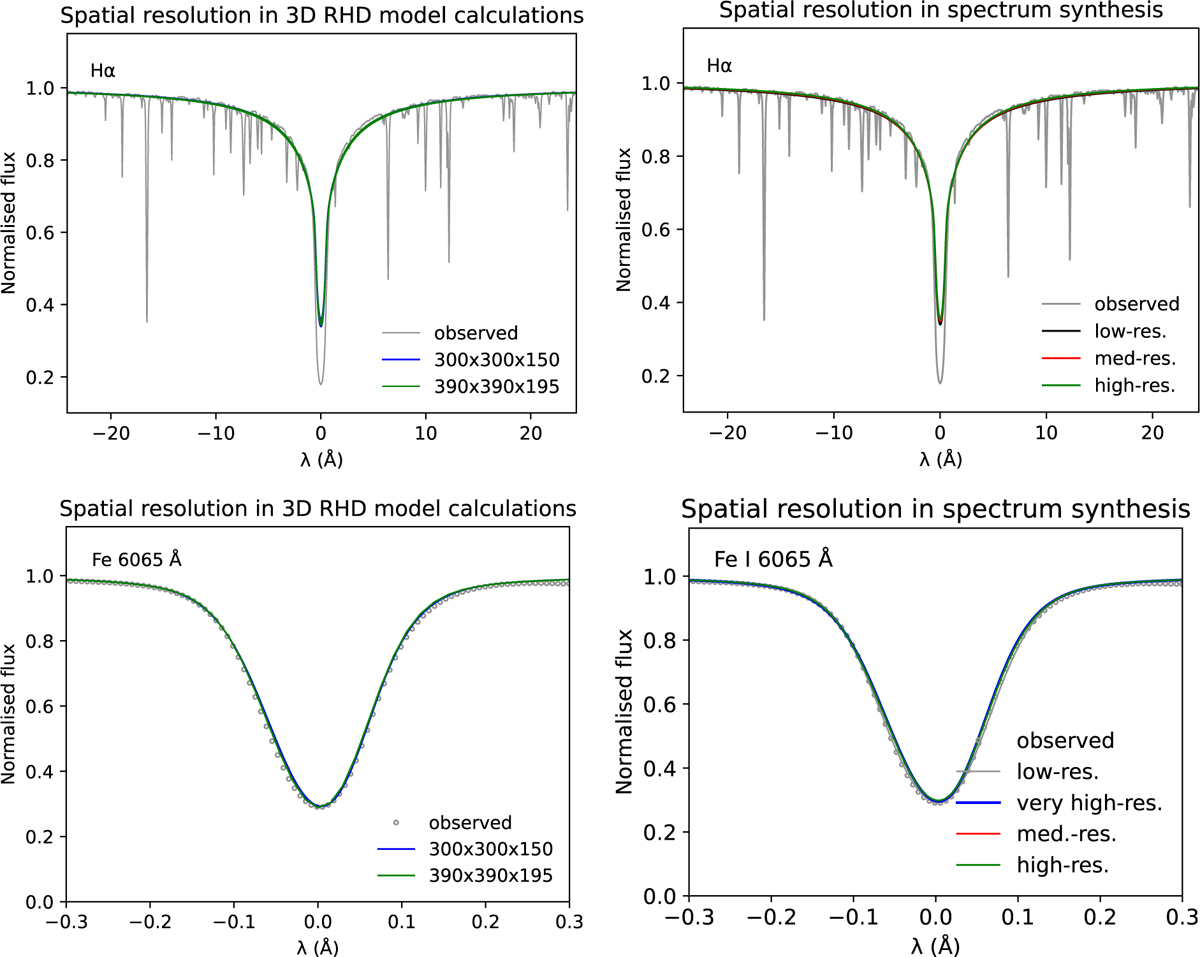
Comparison of Hα and Fe I line profiles computed with M3DIS, but with different spatial resolutions used in 3D RHD model calculations (left column) and in the post-processing spectrum synthesis (right column). For the results presented on the left-hand side, we adopt models C and D from Table 2, respectively, where D (Nx × Ny × Nz) = (300, 300, 150) is our reference. For the results presented on the right-hand side, we use 3 characteristic spatial resolutions that differ only in horizontal resolution of (Nx × Ny) = (10, 10) (low – res.), (30, 30) (med. – res.), and (80, 80) (high – res.). For Fe I, we also show for comparison the profile computed a very high horizontal resolution of (150, 150) in spectral synthesis. See text.
Current usage metrics show cumulative count of Article Views (full-text article views including HTML views, PDF and ePub downloads, according to the available data) and Abstracts Views on Vision4Press platform.
Data correspond to usage on the plateform after 2015. The current usage metrics is available 48-96 hours after online publication and is updated daily on week days.
Initial download of the metrics may take a while.