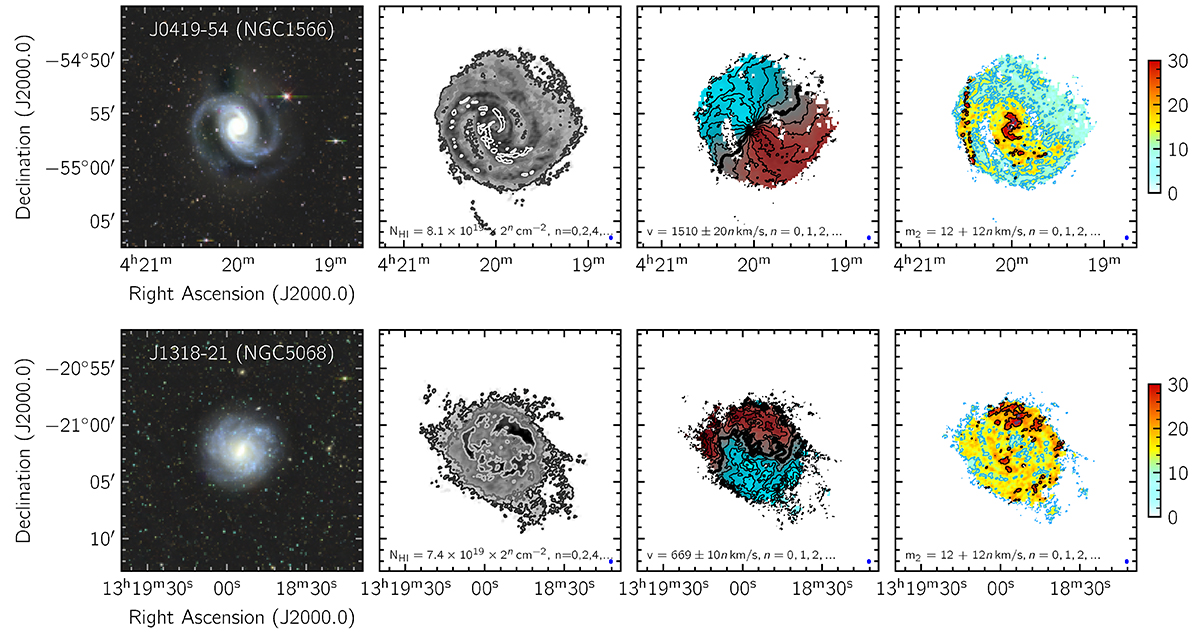
Fig. 8.
Download original image
Example single-track moment maps using the r05_t00 resolution for two MHONGOOSE galaxies. Top row: NGC 1566 (J0419–54); bottom row: NGC 5068 (J1318–21). From left to right: (i): Combined grz-color image from DECaLS. (ii): Primary-beam corrected zeroth-moment or integrated H I intensity map. Contours as indicated in the figure. The lowest contour represents S/N = 3, with subsequent contour levels increasing by a factor of two. (iii): First-moment map or intensity-weighted velocity field. Red colors indicate the receding side, blue colors the approaching side. The central velocity (listed in Table 1) is indicated by the thick contour. Other contours are spaced by 10 or 20 km s−1, as indicated in the Figure. (iv): Second-moment map: colors show the range from 0 (light-blue) to 30 (red) km s−1. The lowest contour shows the 12 km s−1 level, and subsequent contours are spaced by 12 km s−1. The 24 km s−1 contour is shown in black. For both the first- and second-moment maps, pixels corresponding to values below the S/N = 3 column density in the zeroth-moment map were blanked. See Appendix A for a more extensive description.
Current usage metrics show cumulative count of Article Views (full-text article views including HTML views, PDF and ePub downloads, according to the available data) and Abstracts Views on Vision4Press platform.
Data correspond to usage on the plateform after 2015. The current usage metrics is available 48-96 hours after online publication and is updated daily on week days.
Initial download of the metrics may take a while.