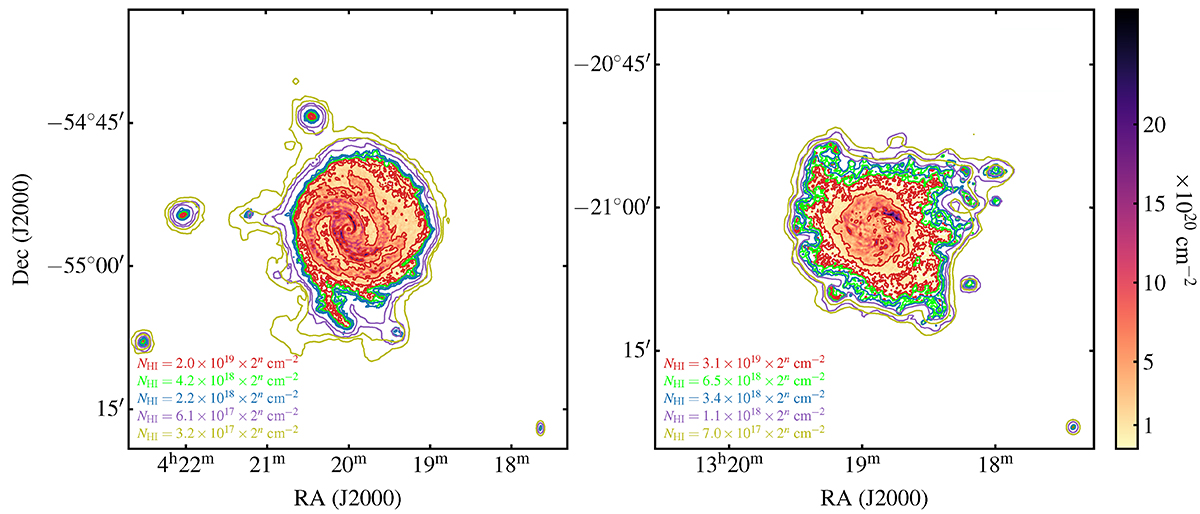
Fig. 7.
Download original image
Multi-resolution zeroth-moment maps of NGC 1566 (left panel) and NGC 5068 (right panel) based on the full-depth data. For each resolution, contours of 2n times the S/N = 3 value are shown (as listed in the legend). The resolutions shown are r05_t00 (red), r10_t00 (green), r15_t00 (blue), r05_t60 (purple), r10_t90 (olive). For each resolution two contours are shown, i.e., n = 0, 1, except for the highest resolution r05_t00 (red contour), where n = 0, 1, 2, … The r05_t00 moment map is shown in the background as a false color image, with the column density levels indicated by the color bar on the right. The beam sizes (colored according to the respective resolution) are shown in the bottom-right corner.
Current usage metrics show cumulative count of Article Views (full-text article views including HTML views, PDF and ePub downloads, according to the available data) and Abstracts Views on Vision4Press platform.
Data correspond to usage on the plateform after 2015. The current usage metrics is available 48-96 hours after online publication and is updated daily on week days.
Initial download of the metrics may take a while.